We won’t lie to you. Launching Paid UA campaigns is not something that ChatGPT can do for you. Yes, we can help with copy, but if you expect to achieve incredible returns through some magic prompts, you’re going to need a lot of luck.
Table of Contents

If you’re one of those who truly believe that ChatGPT can act as an Acquisition/Paid UA team, there’s no need for you to keep reading. But if you’re one of those who prefer that your company doesn’t go bankrupt soon, maybe you’d like to take a look at these guys to improve your campaign operations.
Use case 1: Let analytics guide you where to run campaigns
Money, like time, is infinite. So one of the insights you can get from your data is which countries you should run campaigns in. Imagine you’ve never done Paid UA before or if you have, it’s been a bit of a hit or miss. Well, your data can help you answer questions like:
- “Should we launch campaigns on iOS or Android? (Spoiler: if you’re launching on iOS, we introduce you to SKAN)”
- “Should we launch in the US or UK?”
- “Should we run campaigns in Spanish in the US? There’s a lot of Latinx audiences…”
- “What kind of user do I have right now? What product, course, or item is the most purchased?”
- “How much should I pay for a download at most?”
And so on and so forth… So, to understand how, where, and when to launch campaigns, we recommend that you look at several things in your own data:
Choosing markets and platforms for your campaigns based on organic data
When you don’t have any information about Paid UA results, the best thing you can do is talk to your Data Analysts (if you have them, otherwise we can help you) to understand the behaviour of the users who are coming to you organically. These users who come organically – whether because you don’t have any Paid UA or because they are reported by the MMP as organic – will give you many clues as to where to launch campaigns or where to scale the budget. For example, if you see that you have 3-4 markets that behave very similarly in terms of installation-to-registration conversion rates, you may consider grouping them to launch unified campaigns. Doing this has a great advantage in that you know they behave similarly and it will also allow you to have more impression volumes in your Ad Networks, which will lead to better installations and, hopefully, better Cost per Install (CPI). Another example could be that, with a limited budget, you decide not to launch campaigns in the same countries on Android and iOS. Imagine that a country like Germany behaves radically differently in organic on both platforms. And, after discussing it with the Data and Dev teams, you realize that it is due to a major bug in iOS, whose resolution will take 3 weeks. So, as that bug will also affect users who come through Paid UA, you may decide to launch campaigns in Germany on Android until the bug is fixed. Well, fixed and thoroughly tested.
Combine organic + paid data to understand winners and losers
Certainly, making initial decisions about Paid UA with organic data is something interesting. But once you launch your Paid UA campaigns, you need your Data Analytics team (or yourself, if you’re skilled enough) to help you operate with insights combined from Organic + Paid. Here, VERY interesting data to extract is the data that will help you understand well how different users behave when they come through paid channels (Meta Ads, Twiter Ads, Apple Search Ads…) compared to organic ones. Country by country and platform by platform. How could we do this? By comparing Acquisition channels against the Blended. That is, understanding how each channel performs compared to the average conversion rate at each stage of the funnel. Imagine that we are working with an e-commerce app that has several conversion stages (CVR):
- Install to Signup (I2S CVR) – from when the user installs/opens the app for the first time until they register with their credentials.
- Signup to View Item (S2V CVR) – from when they register until they view a specific product page. Let’s imagine it’s a pair of “Fancy Winky” sneakers.
- View Item to Purchase (V2P CVR) – from when they view the Fancy Winky sneakers until they decide to buy them.
- Install to Purchase (I2P) – the total conversion of the three previous steps. If you really like math, it’s calculated by multiplying the three previous conversion rates.
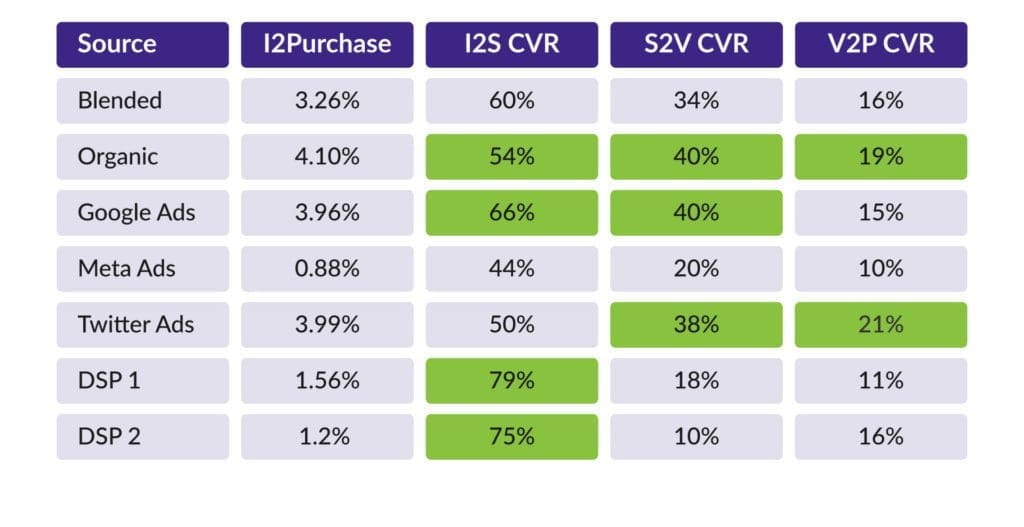
What does this table tell us?
A lot of things, such as:
- We need to improve the conversion data from Install to Signup from sources like Meta Ads and Twitter Ads
- DSPs perform very well in the top funnel stage of registration but are average to poor in the middle stage
- DSP 2 has a lot of potentials if we can improve the Signup to View data since it converts as well as the Blended and is better than any other paid channel at the View to Purchase stage
And many other insights. Keep in mind that we have provided a VERY brief example at the Ad Network level, but you can go deeper by the campaign, ad group, ad, keywords, countries, tiers, platforms… endless possibilities!
Use case 2: determine your CPIs/CPEs based on conversion rates
Another way to make the most of your data is to understand what CPI or CPA you should aim for in order to make the conversion of the product profitable. We have seen before how some channels convert better than others in funnel stages and what to do with those insights, but how do you know if you’re overpaying or underpaying? Let’s take a specific channel from the previous table as an example: Google Ads. Imagine that users who come through Google Ads, when they make a purchase, spend an average of $50. We can calculate the maximum amount we could spend on each event prior to purchase, using the conversions we have seen before.
First, let’s calculate the maximum cost per purchase to achieve a ROAS of 1.
- Revenue per purchase = Average ticket price = $50
- Maximum cost per purchase = Revenue per purchase / ROAS = $50 / 1 = $50
Next, we can use the conversion rates to calculate the maximum cost per install, signup, and view an item to achieve the maximum cost per purchase of $50 while maintaining a ROAS of 1.
- Conversion rate from install to purchase = 66% x 40% x 15% = 3.96%
- Revenue per install = Average ticket price x Conversion rate from install to purchase = $50 x 3.96% = $1.98 → Cost per Install (CPI) = $1.98
- Conversion rate from signup to purchase = 40% x 15% = 6%
- Revenue per signup = Average ticket price x Conversion rate from signup to purchase = $50 x 6% = $3 → Cost Per Signup = $3
- Conversion rate from view an item to purchase = 15%
- Revenue per view an item = Average ticket price x Conversion rate from view an item to purchase = $50 x 15% = $7.50 → Cost per View an Item = $7.5
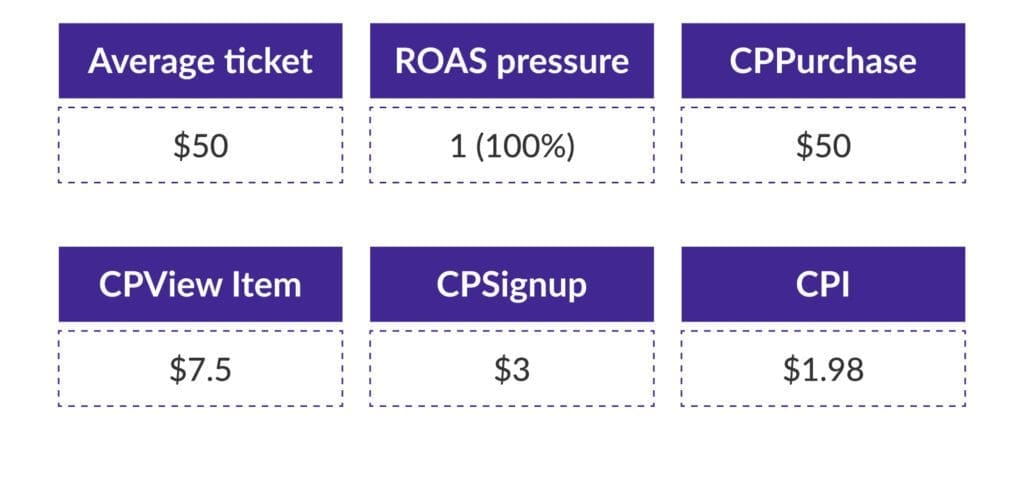
As you can see, if we demand a different ROAS from our campaigns (either higher or lower than the current one), our Costs per Event – install, signup… – will change. If we demand that our campaigns monetize better, we will not be able to afford to pay as much. Similarly, if you want to make more money in the stock market, you may have to take more risks and invest more capital.
What about my competitors’ CPI / CPA?
Another thing you need to do is understand, especially for CPIs, how much your competitors are paying on each Ad Network. Because, continuing with the previous case, if your competitors are paying $1 per install on Google Ads, it is very likely that you will need to pay at least the same. And this creates two dilemmas for you. 1. If you pay less, you will generate fewer impressions and therefore installs – since Google will prefer to give the ad impression to those advertisers who pay more. Just like in an art auction where a Picasso painting is sold to the “highest bidder”, Google does the same with its advertising inventory. In summary, if you pay peanuts, you’ll get monkeys.
2. If you pay more than your target CPI, your campaigns will not be ROAS-efficient – and in this case, it is because your product’s conversion rate does not allow you to pay more (as we have seen). So here what you would have to work on is improving the product’s conversion metrics so that each install that comes to the product has a better chance of ending in a purchase. And therefore, you can afford a higher CPI.
Use case 3: Identify the optimal CVR for your app based on the CPIs you obtain
Just like before we used our conversion rates to identify the maximum CPI we could have (in a scenario of established ROAS), with data we can do just the opposite. And believe me, your managers and product colleagues will thank you. A LOT.
ROAS 100% – Scenario base
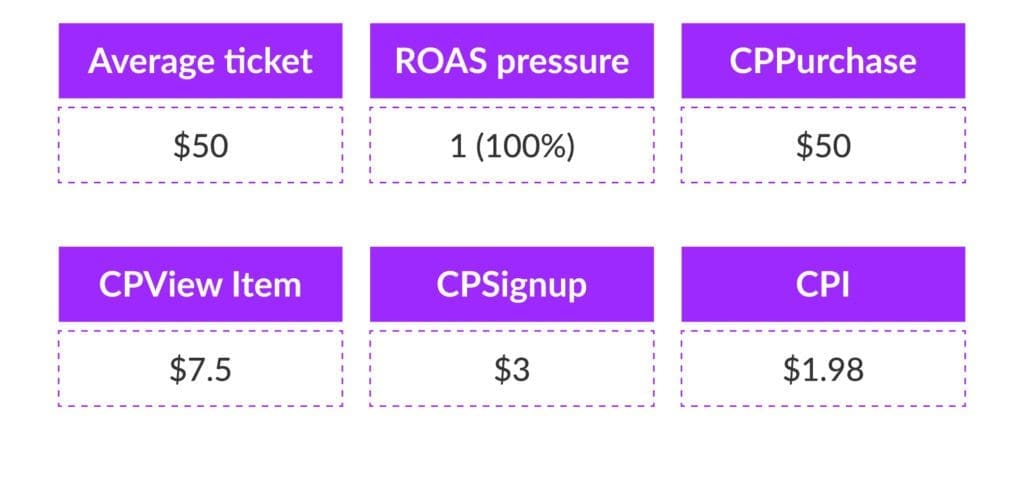
Certainly, just as we used our conversion rates earlier to identify the maximum CPI we could have (given a scenario of established ROAS), we can also do the opposite. And believe me, your managers and Product team will greatly appreciate it. A LOT. Because, taking the Google Ads example from before, you know that to achieve a ROAS of 1 / 100%, you have to pay a maximum of $1.98. But, if you want to increase the ROAS of your campaigns, your app company can do two things (or both at the same time):
- Reduce the CPI of the campaigns – as we have seen before, if not accompanied by anything else, it is not the best idea in the world
- Increase the Conversion Rate within the product – because, with better CVR and the same CPI, there is a greater capacity to generate events down the funnel and, hopefully, better returns.
Now, let’s imagine that we work on the product in various experiments to improve our conversion rate from download to signup. How much we would pay per install would depend on how much the numbers improve in that phase of the funnel.
CPI scenarios improving Install to Signup CVR
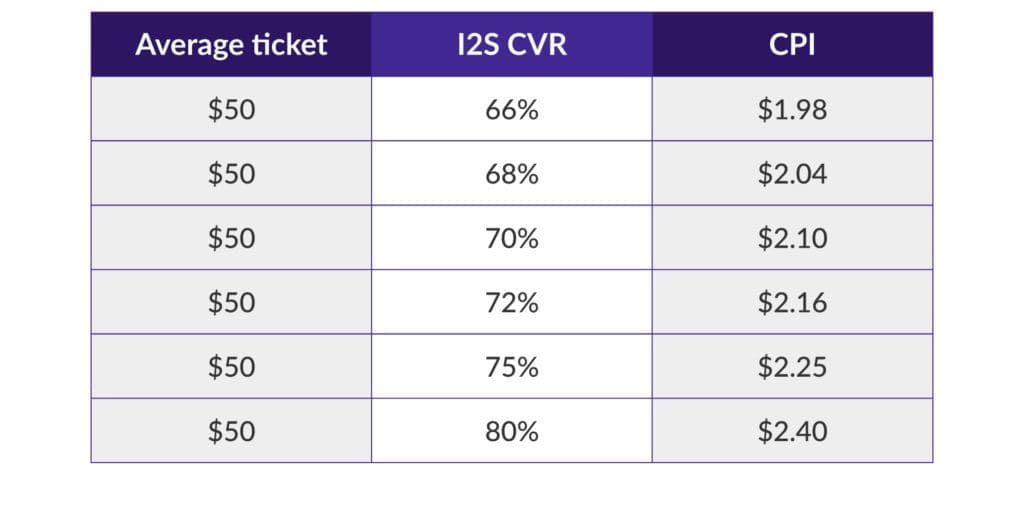
Therefore, you can imagine that if we manage to improve that initial phase of the funnel in the app (and nothing gets worse along the way), we will be in a scenario where we can afford a higher CPI in our campaigns without affecting their ROAS. And, thanks to this higher CPI, we can certainly have a greater number of impressions, clicks, and… guess what, downloads! Wonderful, isn’t it? So, if someone ever tells you that the ROAS of campaigns depends solely and exclusively on what you do with them and not on how the product itself and its performance accompany them… 
A picture is worth a thousand words, right?
Use case 4: Find and combat creative fatigue
Imagine you go running today in the park across the street from your house. And tomorrow, and the day after, and the next, and the next, and so on for 60 days. Without changing parks or the area you run in. Eventually, you get tired of the park and your ability to meet new people decreases. Because you see almost the same people every day and they no longer surprise you. Well, the same thing happens to the creatives in your campaigns. And this is what is called creative fatigue. Creative fatigue is defined as the decrease in performance of your creatives when they have been in “production” for too long. That is, people have already seen them a lot and the ability to generate clicks is getting lower and lower. And how do we identify this other than the usual Ad Frequency metric? It’s simple: through the CTR (conversion rate between clicks and impressions) of your campaigns. 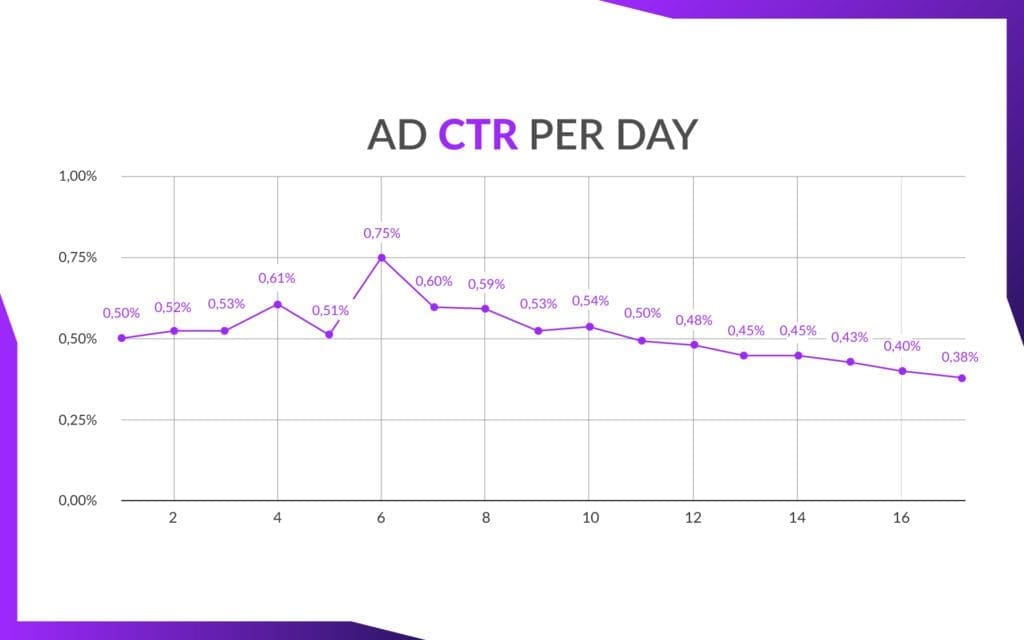
What does this image tell us? It tells us that from day 7-8, the creatives start to convert less and less. And here, we may think that the audience is not the right one, but we must definitely consider that it may be time to change them and try something new. Because we tend to think that creative fatigue usually happens after the first two weeks. But don’t relax, because this can happen at any time and you have to be prepared to move fast.
What happens if we ignore this insight?
Well, besides the fact that people will probably question why they are helping you, you will see how the performance of your campaigns continues to decrease due to creative fatigue. If your creatives generate fewer and fewer clicks, you will have less “mass” to make those clicks potentially turn into installations. And that’s not taking into account that:
- Your ability to convert clicks to downloads may also vary (we talked about this in the article on CRO for your store).
- Even if you keep getting installs, it is possible that – as we have seen – your conversion to in-app events (registration, view item…) is also constantly changing.
- It is even possible that your users are spending less (average ticket), which may require you to rethink the maximum CPI you can pay. This, combined with a lower CTR of your campaigns, makes the news doubly negative.
Conclusion
If you don’t want to go blindly with your campaigns and have your money invested worse than Lehman Brothers in 2008, you need to be aware that you need to use, read, and be able to handle data and BI/DataViz tools. Basically, because the performance of your campaigns (and even your own) is at stake. But don’t panic. Because you probably already have enough on your plate with day-to-day tasks without having to worry about not paying attention to those dashboards you should be looking at often. So, if you’d like to chat and have us help you not only give more love to data but also turn it into better results for your company, we’re happy to lend a hand. Oh, and you’ll get all the credit. Promise.