Winning with a powerful data visualisation setup
In today’s data-driven environment, organizations need to extract valuable insights from a sea of information. As a pioneer in this arena, Admiral Media harnesses the power of cutting-edge technology and adept human interpretation to fuel performance marketing strategies that consistently hit their mark. Our secret? We’ve created a data management ecosystem that combines state-of-the-art tools such as Improvado and Google BigQuery, robust APIs in collaboration with partners like Adjust, Appsflyer, Singular, and GA4, and a team of seasoned marketers who excel at deciphering complex data landscapes. We handle data from all major ad networks, such as Moloco, Meta, Snapchat, TikTok, and Google, converting it into actionable insights through the lens of Tableau, a leader in data visualization.
Table of Contents
“We’ve created more than just dashboards – we’ve built strategic tools that drive global business growth and make marketers’ lives easier. Our commitment to real-time, actionable insights sets our high standards in performance marketing.”
– Sikander Khan – BI @ Admiral Media
 “We’ve created more than just dashboards – we’ve built strategic tools that drive global business growth and make marketers’ lives easier. Our commitment to real-time, actionable insights sets our high standards in performance marketing.”
 Strategic, Analytical, and Tactical Dashboards: Our Three-Tiered Approach
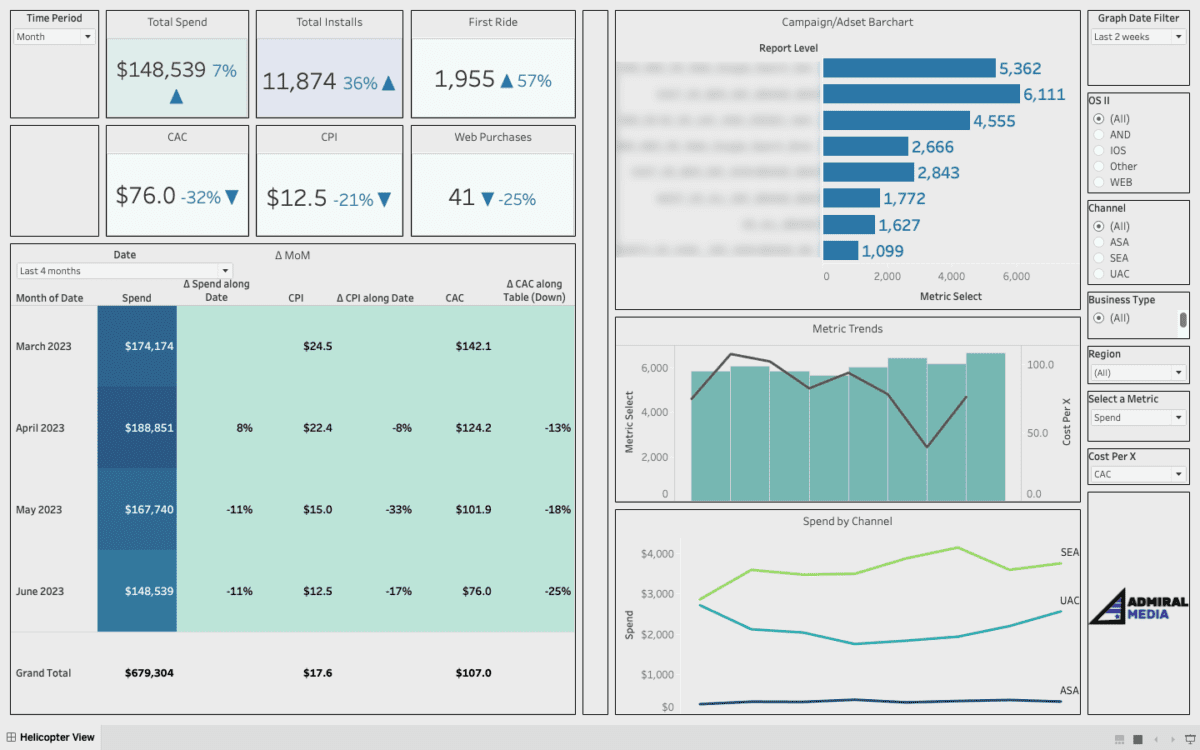
Strategic Dashboards:
Our strategic dashboards, primarily intended for executives and stakeholders, focus on conveying the big picture of our performance marketing efforts. They highlight crucial metrics like Return on Advertising Spend (ROAS), overall campaign cost, total conversions, and other key performance indicators (KPIs). We understand the power of comparative analytics in strategic decision-making. Hence, our dashboards include features like trend lines, WoW or MoM percent changes, and variance reports to emphasize performance fluctuations and growth patterns. For instance, we might use area charts to visualize the trend of costs over a specific period or a map view to demonstrate geographical performance.
Analytical Dashboards:
These dashboards are the backbone of our day-to-day operations and data-driven decisions. Primarily used by analysts and marketers, they offer a comprehensive look at our campaigns. Key metrics here could include retention rates, in-app events, cost per click (CPC), click-through rate (CTR), Impressions, and further detailed conversion data. The power of our analytical dashboards lies in their versatility and depth. They provide marketers with the ability to drill down from high-level data to granular insights. For example, our tables offer week-over-week or day-over-day comparisons, enabling the identification of patterns or anomalies over time. We also use scatter plots to identify correlations between different variables or box plots to understand the distribution and outliers in our metrics. 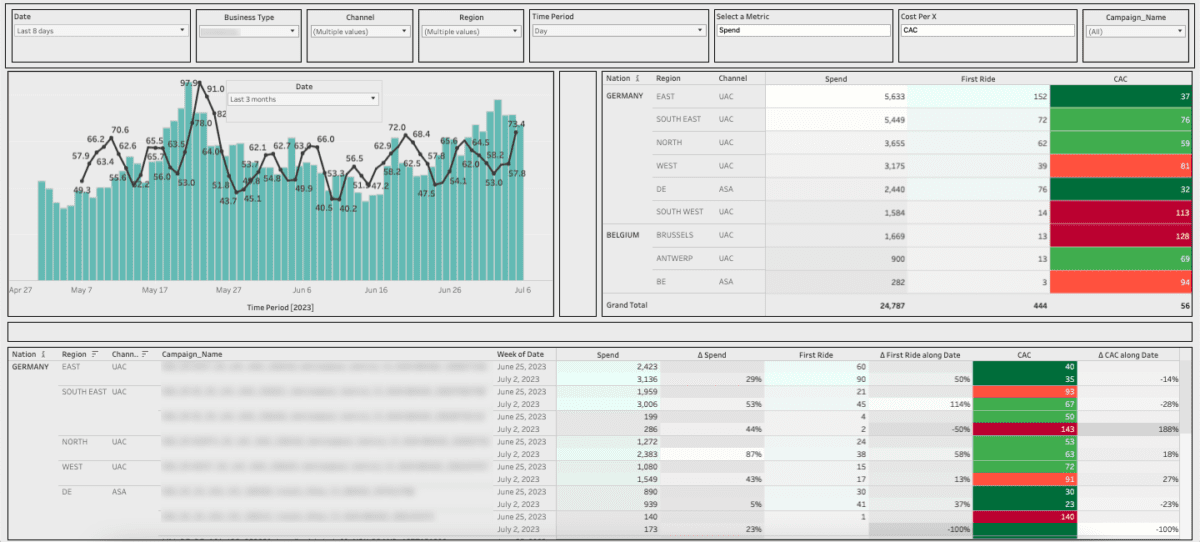
Creative Dashboards
Our Creative Performance Dashboards are a fundamental tool for optimizing our ad strategies. These powerful dashboards offer a comprehensive view of each ad creative’s performance, showcasing data through a series of horizontal bar charts. This layout allows users to instantly identify the performance of each individual ad creative across various campaigns. The key strength of these dashboards lies in their ability to deliver ad-level insights. They break down complex data and present it in a way that allows users to see exactly how each creative is performing within its specific context. This granular, ad-level analysis helps identify trends and patterns in creative performance that contribute to the overall success of our campaigns. Moreover, the Creative Performance Dashboards update up to four times a day, offering nearly up-to-the-minute data. This ensures that our marketing teams can respond promptly to changes in ad performance, optimizing effectiveness and maximizing return on investment. 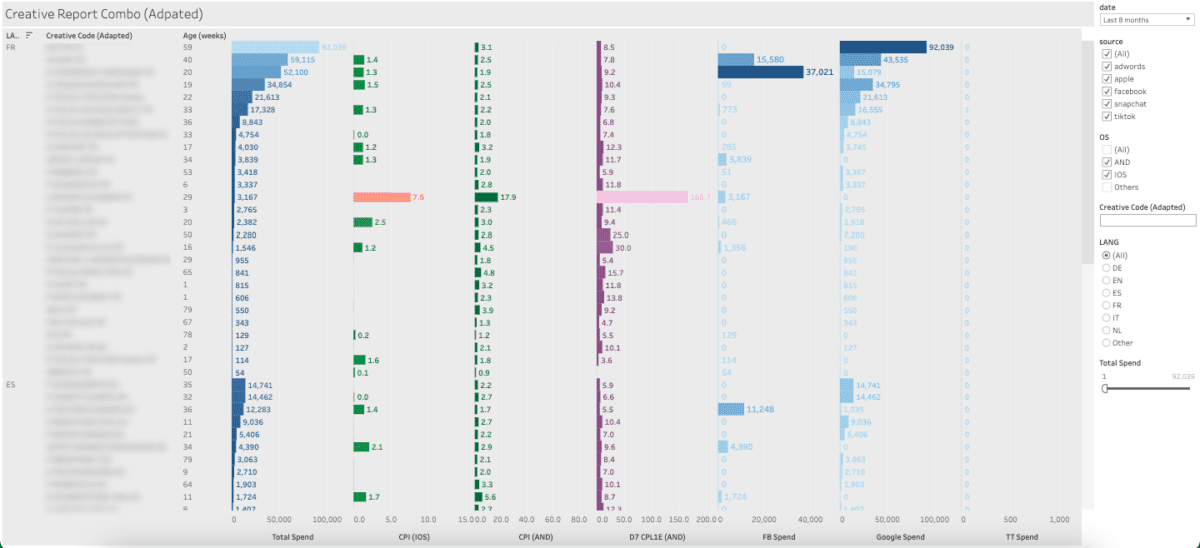 The dashboard’s design must always promote ease of use, offering a visually intuitive representation of complex data. By providing clear, visual insights into the performance of each ad creative, the dashboards support data-driven decision-making and foster a culture of transparency and accountability within our team.
The Power of Comparisons:
A significant aspect of our approach to dashboarding involves comparisons – whether comparing performance against a set benchmark, comparing current performance to past performance, or comparing performance across different campaigns, geographies, or customer segments. These comparisons, often represented as percent difference calculations or as time-series charts in Tableau, provide crucial context for our metrics and KPIs. They help us understand not just where we are, but how far we’ve come and how we’re doing relative to our goals or to other parts of our business. By blending industry-leading tools and in-depth data analysis with our extensive experience in performance marketing, At Admiral Media, we ensure our clients can navigate the digital landscape confidently, armed with real-time, actionable insights. With a keen eye on the past and present, and a clear vision for the future, our data practices keep us, and our clients, a step ahead.
Up-to-date Dashboards:
The ability to monitor campaigns and constantly adjust strategies is a game-changer in performance marketing. Here, Admiral Media truly leverages the potential of Tableau’s dashboards to create a significant competitive advantage. Our up-to-date dashboards contain the most recent data, offering unparalleled visibility into our marketing operations. This means we can respond immediately to changes in campaign performance, industry trends, or customer behavior, providing us with the agility that is paramount in the fast-paced world of digital marketing.
How we utilize Up-to-date dashboards:
-
Immediate Insights:
Our up-to-date dashboards provide an instant snapshot of our marketing performance. This includes data on clicks, conversions, impressions, and other key metrics. By presenting this data in easily digestible visual formats like line charts for trend analysis or pie charts for distribution insights, we enable swift interpretation and action.
-
Proactive Decision Making:
By continuously monitoring our performance data, we can spot issues as they occur and address them immediately. This might involve adjusting ad spend, tweaking ad creative or targeting, or responding to sudden changes in the market. Up-to-date data empowers us to be proactive rather than reactive.
-
Enhanced Personalization:
Up-to-date data allows us to understand our audience better. We can see which ads are performing best, which demographics are responding, or which time of day is generating the most engagement. This insight can be used to personalize our marketing efforts, enhancing customer experience and maximizing ROI.
-
Increased Accountability:
With up-to-date dashboards, we provide complete transparency to our clients. They can see exactly how their campaigns are performing at any given moment, fostering trust and collaboration.
-
Testing and Optimization:
Up-to-date data is vital for A/B testing and ongoing campaign optimization. We can test different creatives, ad placements, or targeting strategies, monitor their performance in real-time, and quickly iterate based on the results. In sum, up-to-date dashboards are not just a nice-to-have feature in performance marketing, they are a strategic necessity. With these dashboards, Admiral Media continues to be cutting the edge of data-driven marketing, delivering stellar results for our clients.
Do’s and Don’ts of Data Visualization
DO’s:
Keep it Simple:
Avoid overloading dashboards with too many visuals or data points. Clarity is key for quick understanding and decision-making.
Choose the Right Visualization:
Different charts serve different purposes. Choose the visualization that best represents your data and enhances comprehension.
Use Real-Time Data:
The most accurate insights come from real-time data. This helps in making timely and informed decisions.
DON’Ts:
Neglect Data Quality:
Regularly review and update your data sources to maintain reliability. Inaccurate data can lead to misguided decisions.
Overcomplicate:
The goal is to facilitate understanding, not to impress with complexity. Avoid using visuals that may confuse the users.
Ignore Mobile:
Make sure your dashboards are mobile-friendly. In today’s mobile-first world, compatibility with mobile devices is crucial.
Wrapping Up Data Visualization in Performance Marketing
At Admiral Media, our commitment to data-driven strategies, insightful analysis, and responsive decision-making has positioned us at the forefront of performance marketing. We leverage the power of Tableau dashboards and reliable data sources to drive successful marketing strategies and deliver exceptional services to our clients. Our approach sets a benchmark for performance marketing organizations aiming to maximize the potential of their data, revolutionizing the way we look at and understand data in the digital marketing industry.