The thrill of trying out something new, waiting for the first batch of metrics, reading the first-ever reviews – validating app concepts is exciting and extremely interesting. Usually, you get that first batch of users into your new shiny concept via user acquisition (UA). But how much money should you allocate to the first campaign in order to get meaningful results and actually validate the new concept with a good level of certainty? How much should you spend on the first-ever UA campaign for a new app? The total budget depends on the country you want to test your app in, cost per install (CPI), and the number of installs you need to acquire (duh!). In this article, I won’t discuss the country choice (there is a lot of content out there with some useful tips), but I will go through the ways you can estimate CPI and the number of users that is required in order to get reliable in-app metrics. There will be some maths, but I promise it will be fun. This is a guest post by Anna Yukhtenko, Senior Games Analyst at Hutch. Disclaimer: There is no cookie-cutter approach when it comes to app validation. The choice will depend on the app itself, the plans you have for it, its potential future monetization model. Also, the tips I give in this article are more relevant for apps in the validation stage, when monetization is not yet implemented.
Table of Contents
CPI
We all want to know what the CPIs of potential apps look like. After all, CPIs levels help estimate the future popularity of the app. However…you kind of need to try to predict the CPIs to see what your UA validation budget will look like? It is very confusing to try to estimate something you are trying to validate as well. But you have to do it either way, so here is an example action plan:
- Step 1: (Skip this step if it is the first time you are releasing any app): Use your own expertise & experience. If it is an app type that you are familiar with/it is an app type your company is specializing in, you probably know the average CPI levels in the countries & platforms you’ll be validating the concept in.
- Step 2: Look at industry reports by country and get an idea of the average CPI levels for the app type you are validating.
- Step 3: Think about seasonality and the timing of the validation test – e.g. CPIs are generally higher in Q4 and health and fitness apps see crazy spikes in January. So keep seasonal effects for your type of app in mind.
- Step 4: Add a bit on top of the CPI you just estimated, for good measure. The reports might not fully depict the harsh reality, so better be safe than sorry.
Also, to get a confirmation of your estimates, ask friends from the industry or agencies who work with you.
Sample size
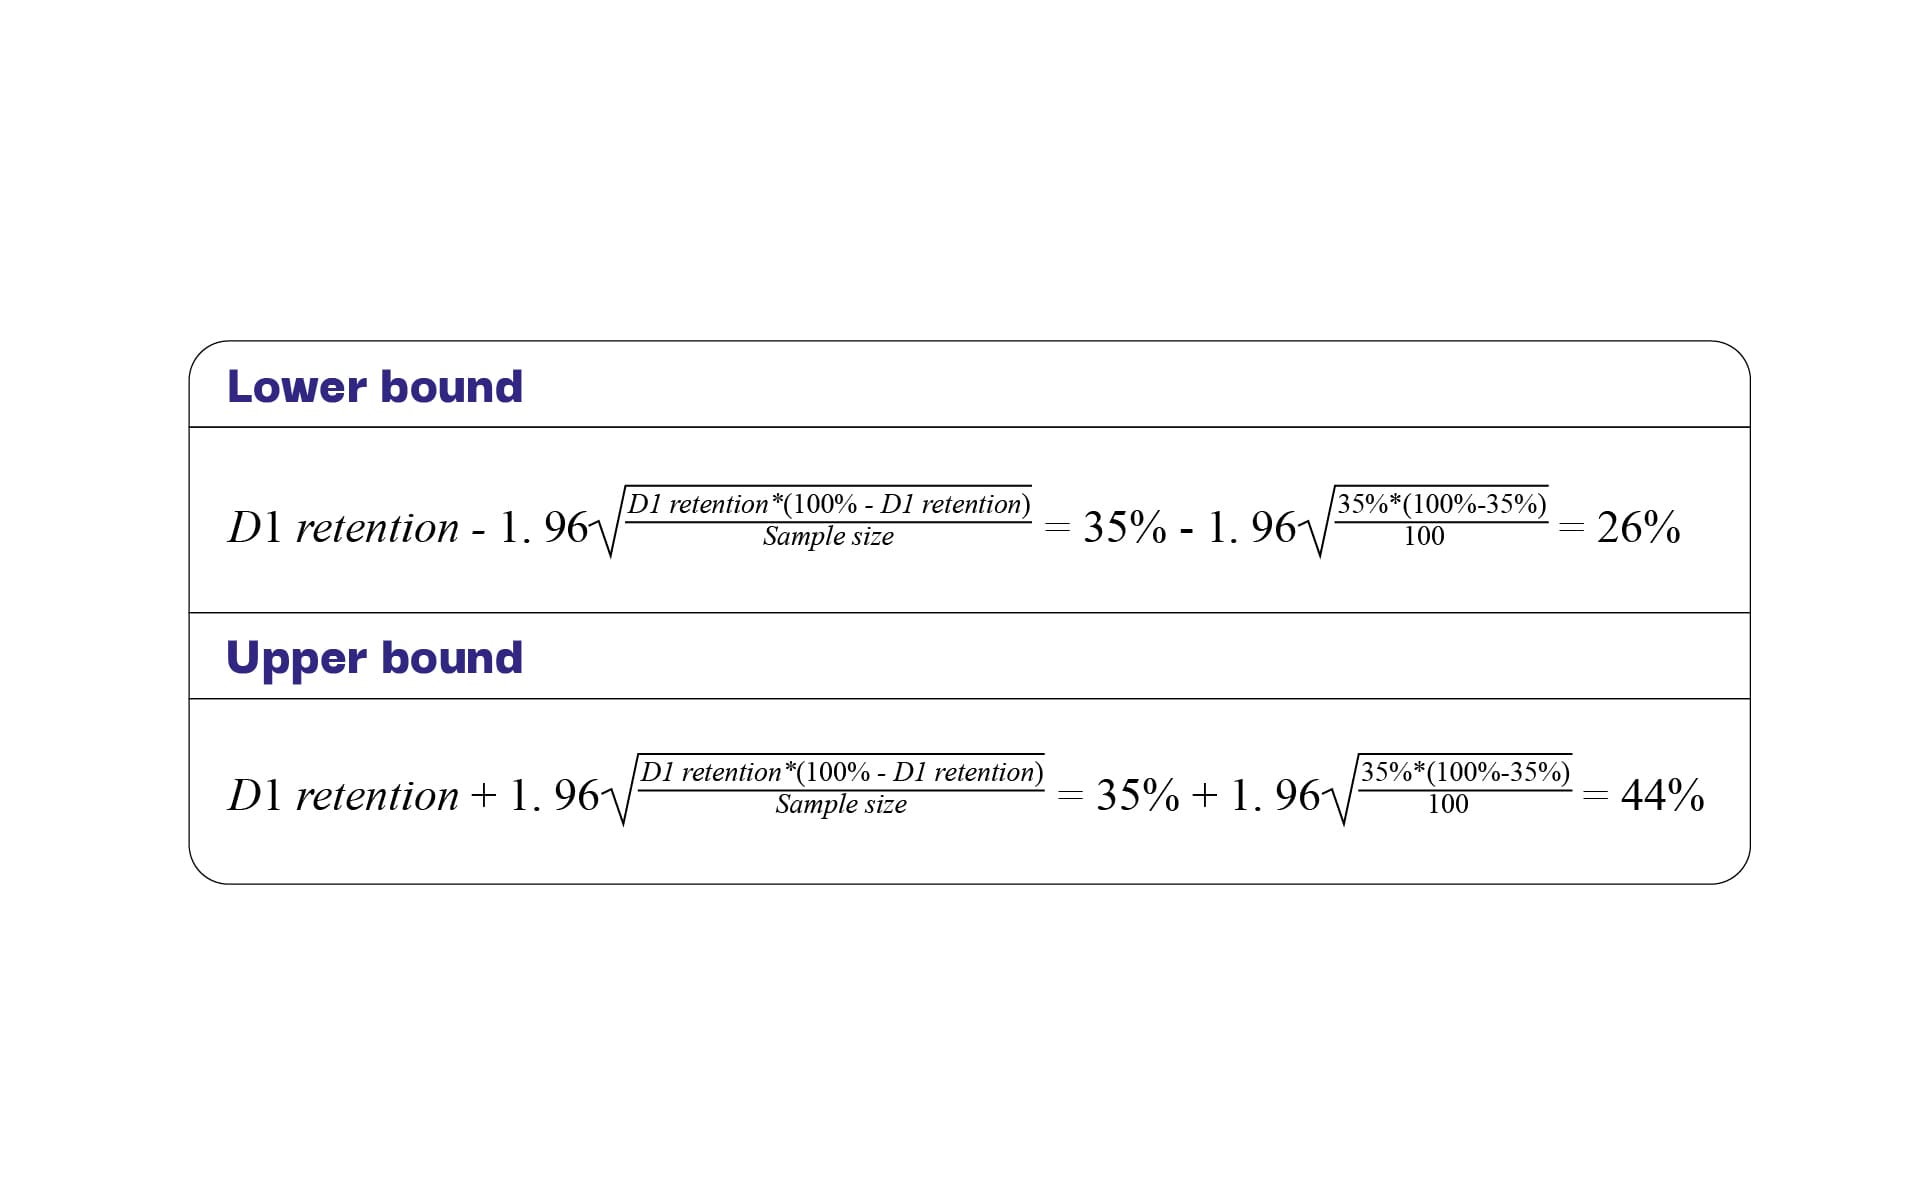
With the CPI question out of the way, it’s time to evaluate how many users we need to acquire to get meaningful results. Statistics suggest that the more users we acquire, the better. But we all have limited budgets and want to be smart about spending! Hence here is a hack on how to cleverly calculate the number of necessary installs and not break the bank. Let’s take day 1 retention as an example metric. After all, it is usually the first metric to look at when evaluating a concept’s success. Think of a target day 1 retention you’d need, depending on your industry and app type. Let’s say, it is 35% for concept invalidation. Say, you acquired 100 users, and 35 of them came back on day 1; hence day 1 retention is 35/100=35%. Decent! But is it a reliable outcome? Let’s engage in some light statistics and build a 95% confidence interval for 35% day 1 retention for a sample of 100 installs. “95% confidence interval” means that there is a 95% probability that the interval between X [lower bound] and Y [upper bound] contains the true value of day 1 retention. The formulas for the upper and lower bounds are from basic statistics, and here is the variant of it for proportions (as the retention % is the proportion of users that came back):

- p = the proportion in your sample (in our case, the proportion of users that came back on day 1)
- Z = the critical value of the z-distribution (in our case, as we would like to estimate a 95% confidence interval, distribution’s critical value is 1.96. This is taken from a z-distribution table. You can also watch this video to understand the process deeper.
- n = the sample size, in our case 100
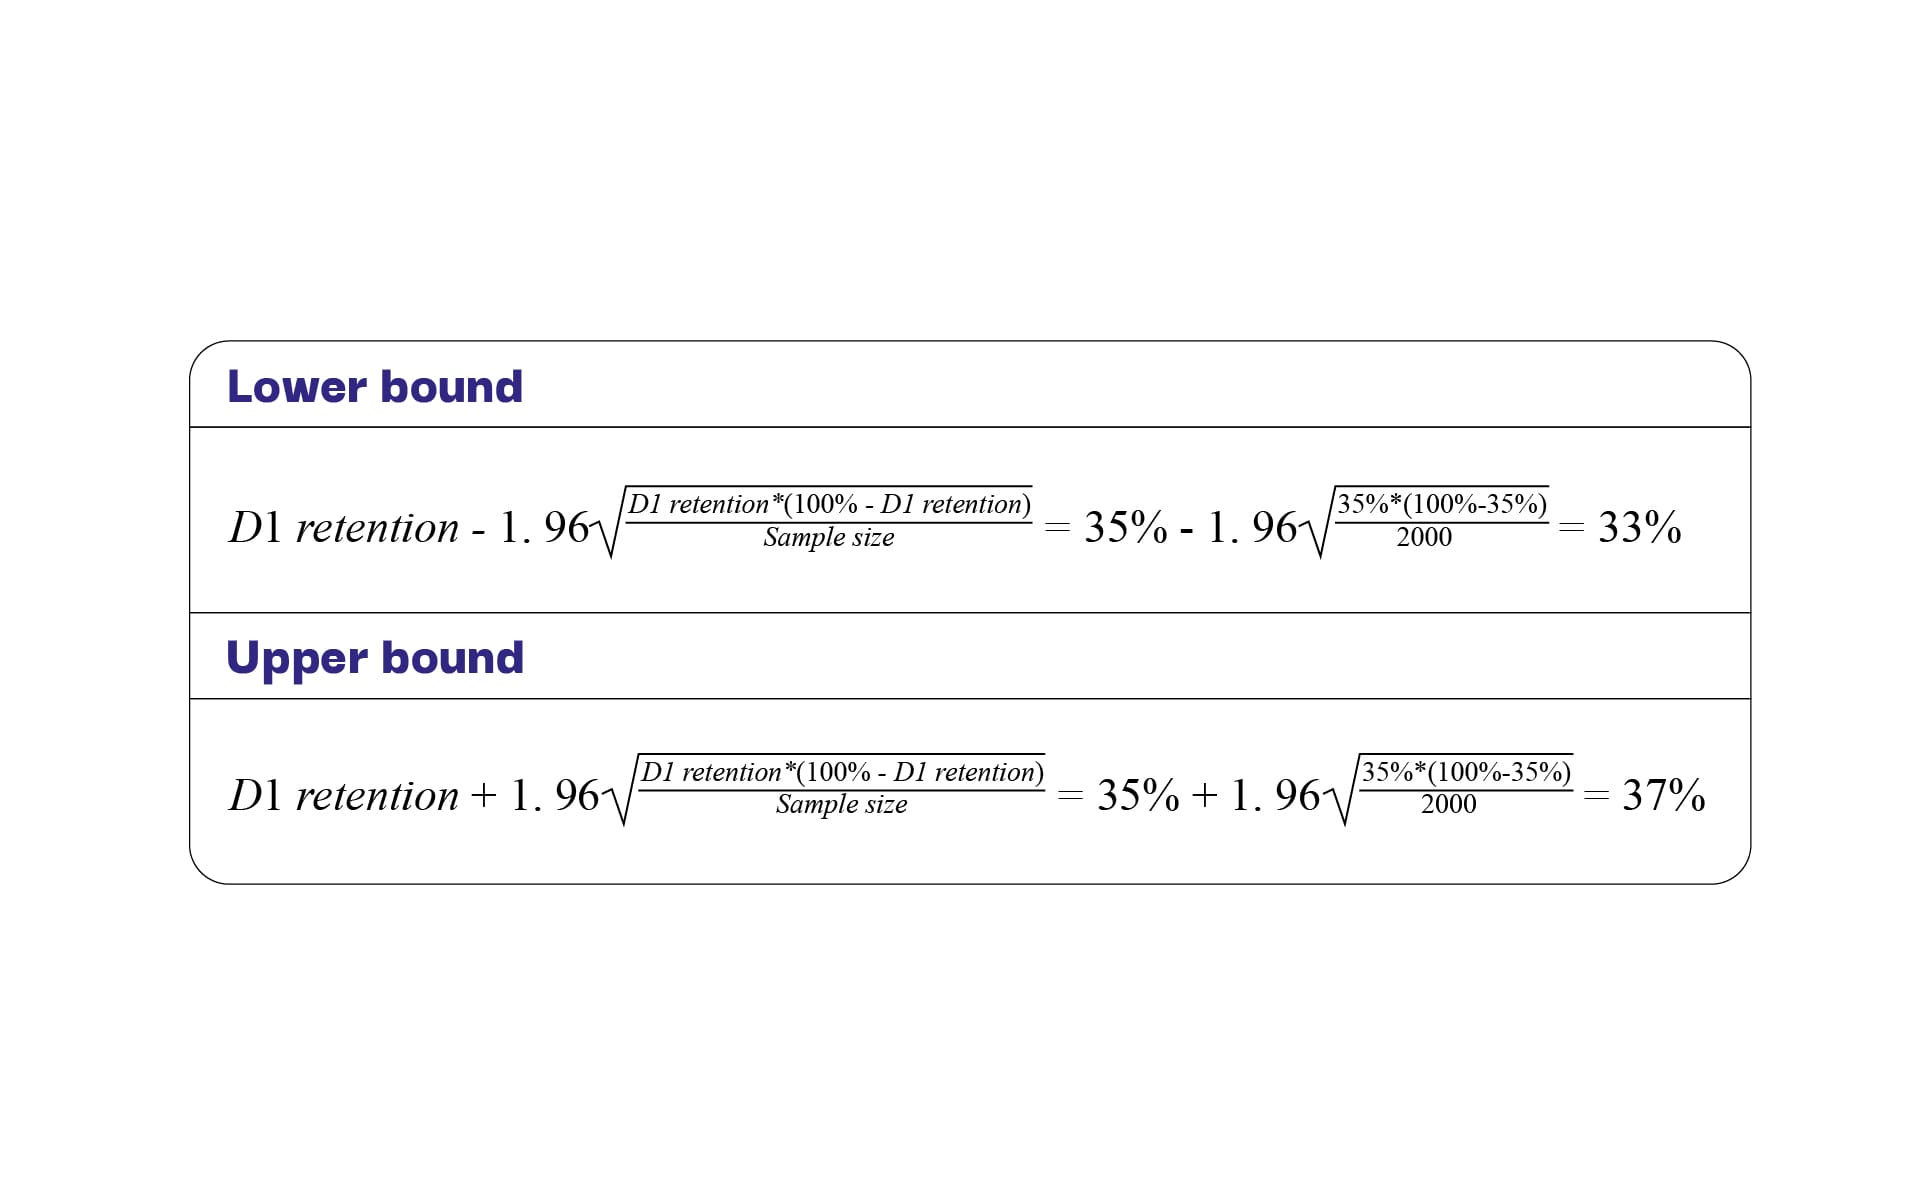
Now, let’s apply the formulas!  So, actually…your retention may be between 26% and 44% with a 95% probability if your sample size is only 100! 44% would be cool as a day 1 retention, but 26% … not so much. Now, what would have happened if you acquired 2000 users, 700 of which came back on day 1 (also 35% retention)?
  Much better! Now we can be more confident about the 35% outcome because day 1 retention is likely to fall somewhere between 33% and 37%. Much closer than the 26% – 44% ballpark! My advice to you – plonk the formulas for lower and upper bound into Excel, play around with sample sizes and possible retention outcomes until you get a sample size that gives you a confidence interval that you are comfortable relying on. Teaser: there is a Google sheet with formulas you can use in a few paragraphs, so keep reading! 🙂 Also, you can use the same confidence interval tactic when comparing day 1 retention between other apps you developed and the validation app. For example:
- App XYZ’s day 1 retention falls into 34-39% range w 95% probability,
- Validation concept’s day 1 retention falls into 33-37% range w 95% probability.
- Is App XYZ’s day 1 retention higher than the validation concept’s? We don’t know because the confidence intervals overlap!
Etc.
Soooo… What’s the budget?
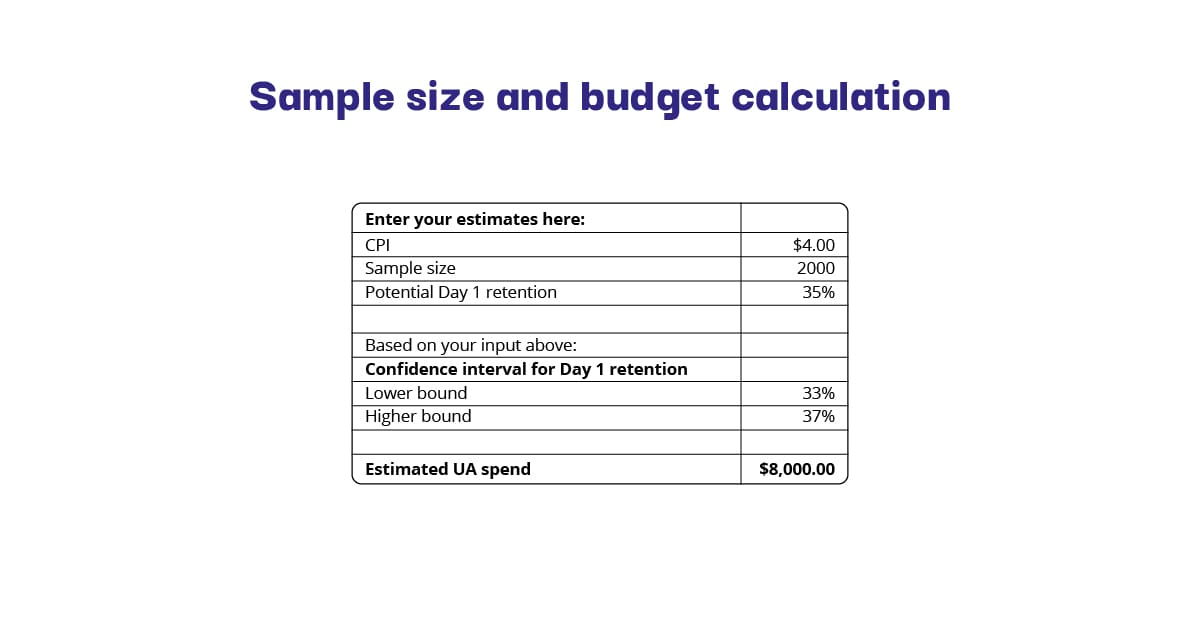
Take your estimated CPI, multiply it by the estimated sample size – and Bob’s your uncle! It is hard to come up with estimates for the first time, but trust me, it gets easier as you go. 🙂  Here is a simplified version of the calculations outlined above. Just put your estimated CPI, sample size, and potential retention in and watch the numbers change: [fusion_button link=”https://docs.google.com/spreadsheets/d/14m4s1xG153NNZaGf-vqlHo6dHFJOa9ZS5Oul_gbaYbY/edit?usp=sharing” text_transform=”” title=”” target=”_self” link_attributes=”” alignment_medium=”” alignment_small=”” alignment=”” modal=”” hide_on_mobile=”small-visibility,medium-visibility,large-visibility” sticky_display=”normal,sticky” color=”default” button_gradient_top_color=”” button_gradient_bottom_color=”” button_gradient_top_color_hover=”” button_gradient_bottom_color_hover=”” accent_color=”” accent_hover_color=”” type=”” bevel_color=”” border_width=”” border_radius=”” border_color=”” border_hover_color=”” size=”” stretch=”default” margin_top=”” margin_right=”” margin_bottom=”” margin_left=”” icon=”” icon_position=”left” icon_divider=”no” animation_type=”” animation_direction=”left” animation_speed=”0.3″ animation_offset=””]Click Here – Sample Size & Budget Calculation[/fusion_button]
P.S.: A useful tip
Put your budget somewhere in a spreadsheet before you start validation UA. After you switch on the campaigns, add the volumes you manage to acquire every day and see how long it takes you to reach the desired amount of users. You can use this information in the future in order to build budgets for your upcoming concepts! Validating app concepts is a tricky business, and creating the first UA budget is not easy either. In some cases, especially if you don’t have a reference, you might get the CPIs wrong. The retention might surprise you, and you’ll realize that the real numbers do not quite match the estimated ones. Treat it as a learning experience for the future, save the numbers for reference, and keep exploring! For more interesting insights, check out our latest articles!


