The horror: declining UA revenue. Usually visible by D7, as few of us are renegades enough to use D1 for LTV predictions. Looking at revenue per user on Day 7 after the install allows an analyst or user acquisition manager to evaluate whether the UA efforts have the potential to be profitable in the future. Or, at least, try to do so. The first question that pops into your head is: “Why?”
Table of Contents
“Is there something off with the targeting? Are creatives fatiguing? Are you exhausting your pool of potential users?” And then you bravely approach the elephant in the room: “Is there something in the app that drags down the UA performance?” In this article, we’ll discuss this elephant. Well, question.
This is a guest post by Anna Yukhtenko, Senior Games Analyst at Hutch.
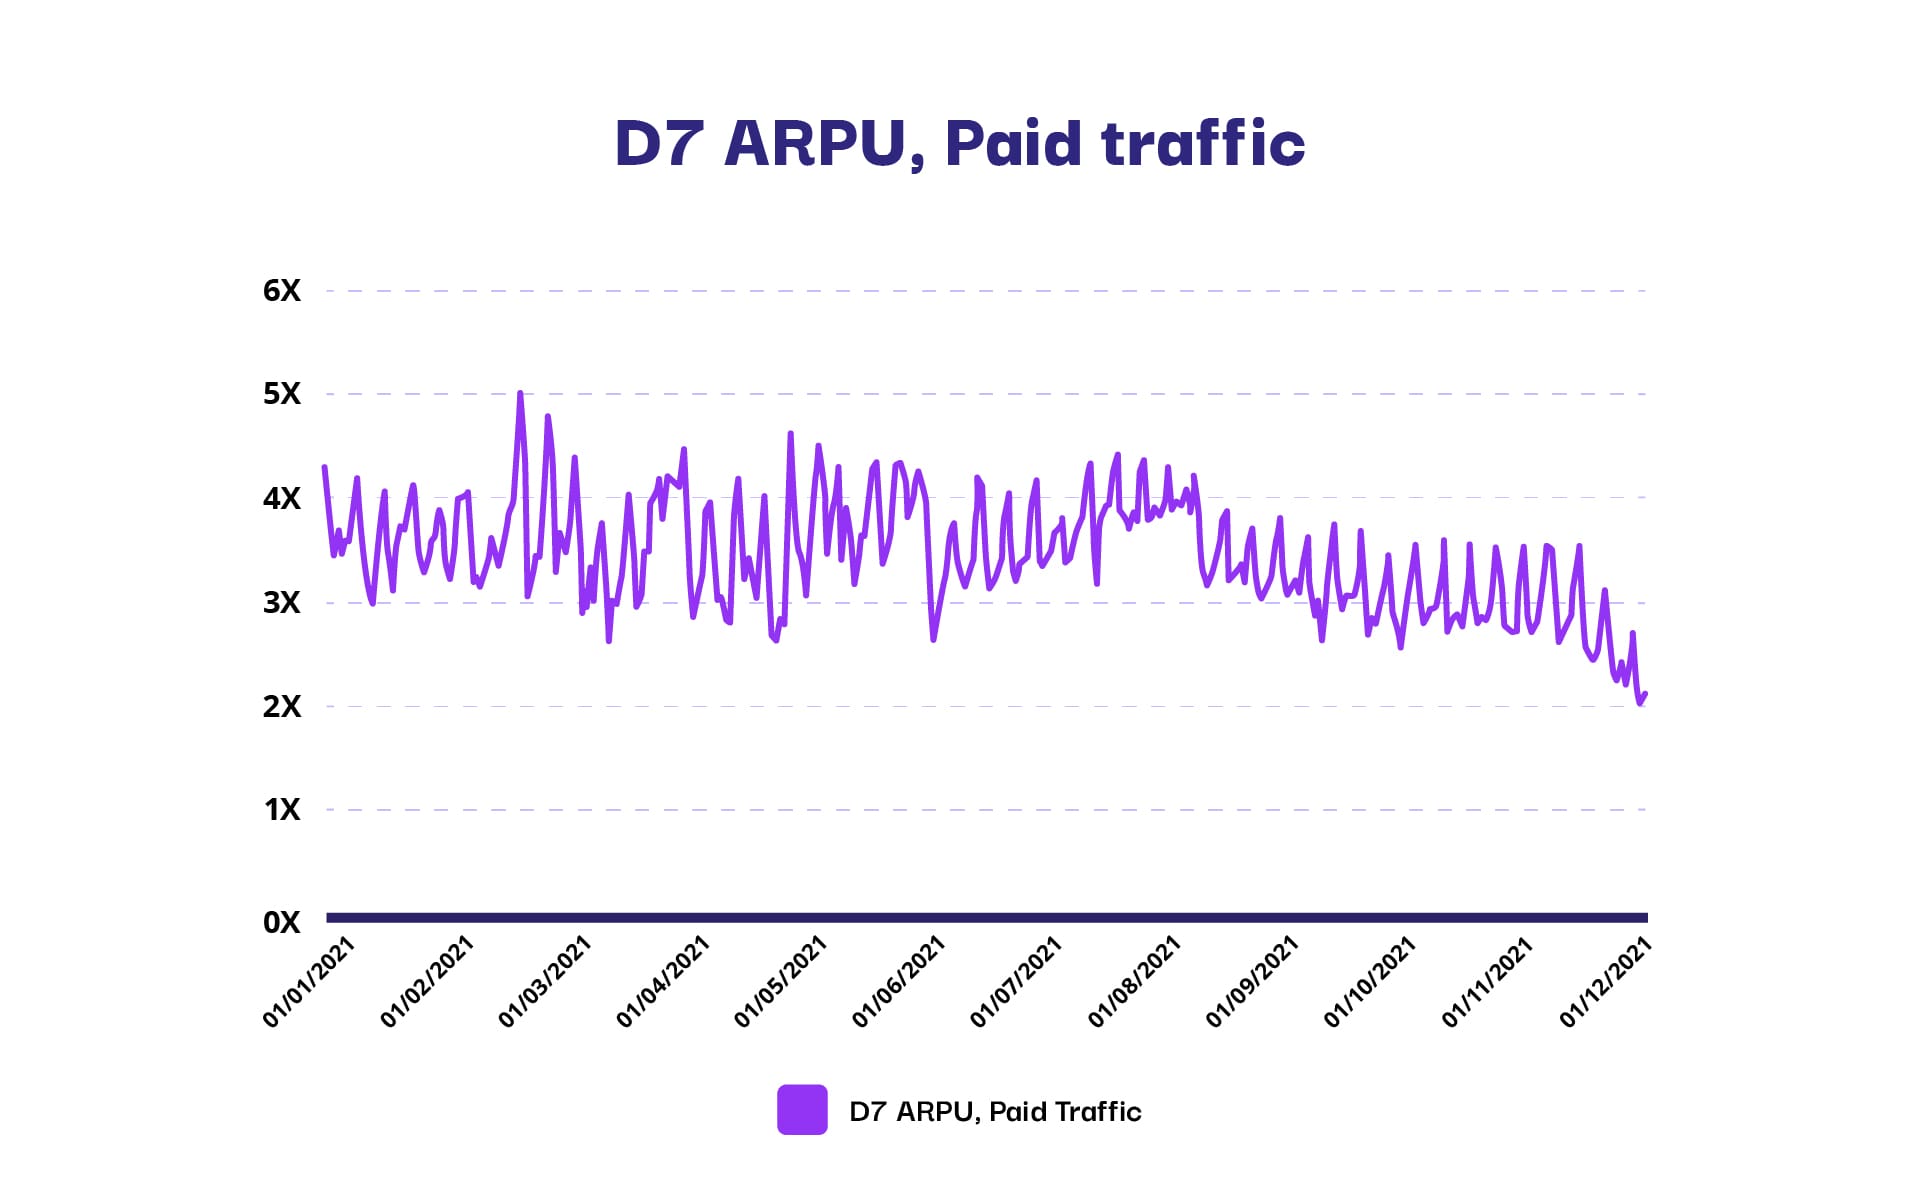
Let’s assume you have the following trend in paid traffic:
Step 1: Declining UA revenue? Don’t panic, look at organics!
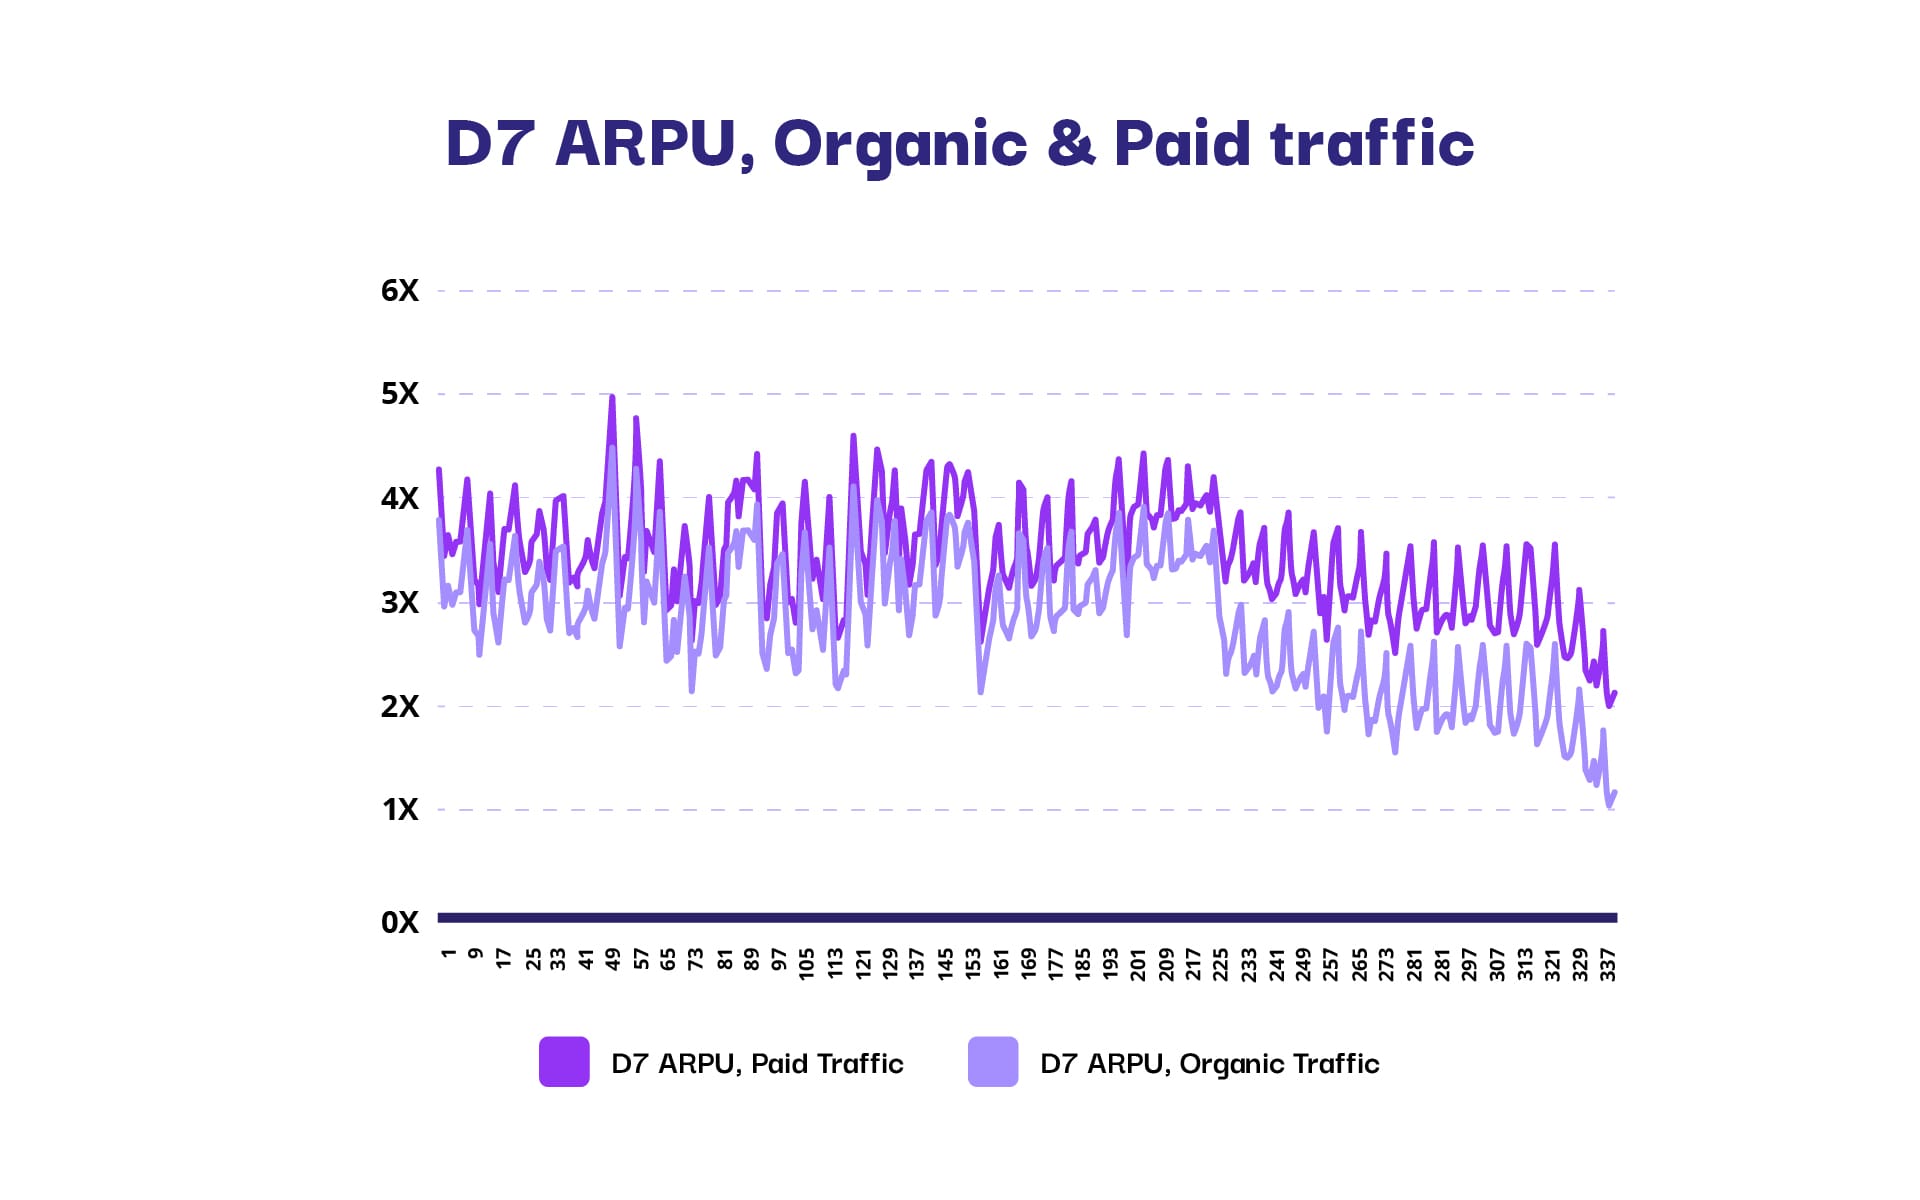
Use your Organic users as a benchmark. The majority of Organics did not come from UA channels, so if there is something really off in your marketing strategy, that shouldn’t show up in Organic performance (but there is a catch, so keep reading!) Hence, the first step is to load the same metric for Organic & UA traffic. Day 7 revenue per user, I presume.
Step 2: Be smart, build more than one chart!
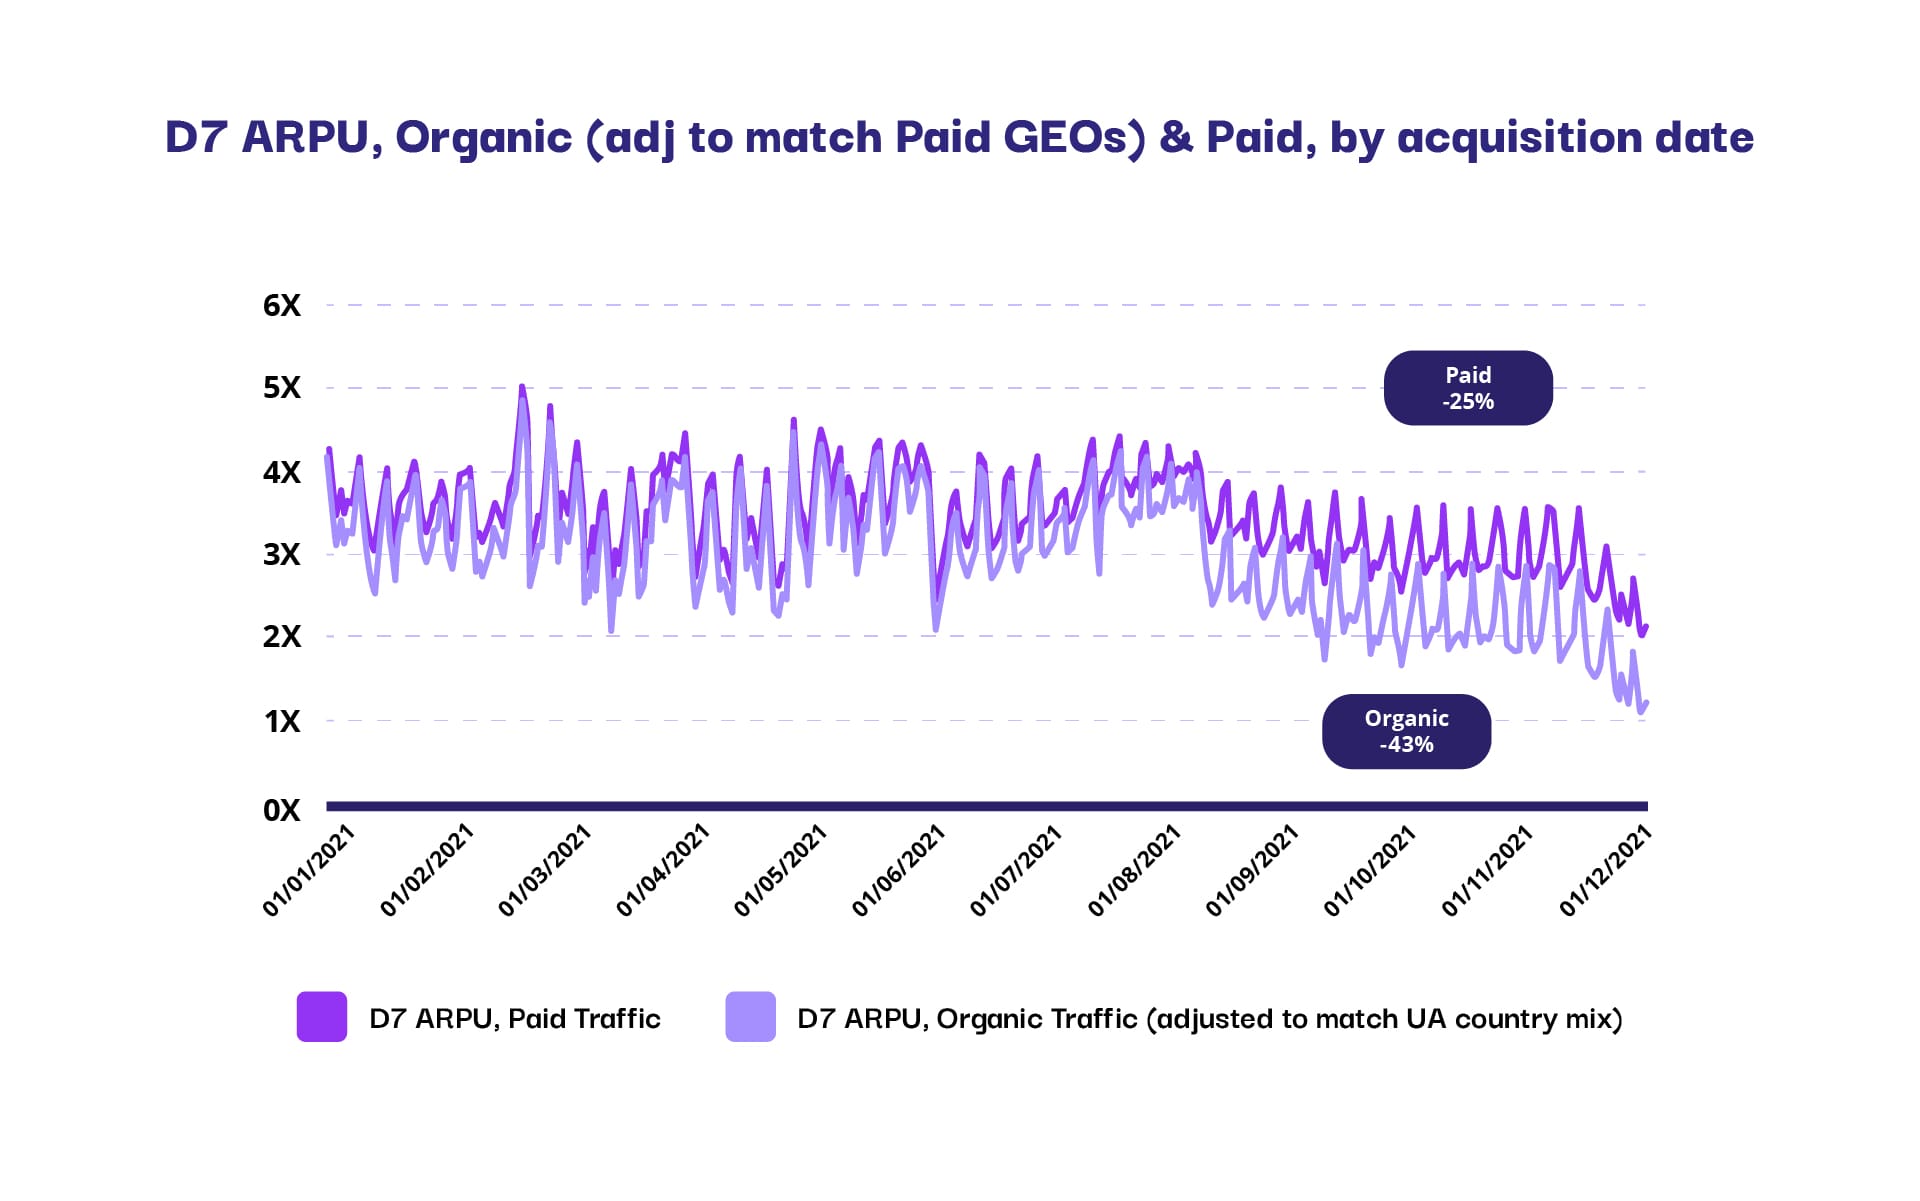
Make sure you account for country and device quality mix – Organic traffic can be structurally different from Paid:

Also, you might have had app store featuring at some point in the past that could have affected Organic traffic – make sure to exclude users acquired at this time.
Step 3: Find a good solution for incrementality and lost attribution!
As mentioned in Step 1, there is a catch. In the perfect world, Organic traffic would have had nothing to do with the Paid. In reality, though, some attribution is lost, privacy settings are applied, and incremental organics tend to happen nearly all the time. Hence, Organic traffic in most cases is somewhat influenced by Paid traffic. This means that the Organic & Paid trends are oftentimes similar to each other anyway. In order to account for that, try to compare the severity of the decline in Day 7 revenue per user and the trend line steepness.
Step 4: Choose the right path – use clever math!
The last thing to check – you are nearly there! – if the reason for the decline in Day 7 revenue per user is the same by organic and paid traffic. Mathematically, there can be 2 reasons for it:
- The decline in conversion to spend
- The decline in average revenue per paying user.
It’s not “either this or that”, but it is important to check whether the reasons for the revenue decline in Organic & paid traffic are the same.  In the example above, the mathematical reason for the decline in D7 ARPU is the same as Organic 7 Paid traffic. Namely, the users are not converting to purchase as much as they did before August 17, 2021, whereas the average revenue per paying user is the same as it was before. What could be a reason for it? Do ask your product manager and analysts, but a good example could be a delay in showing the starter pack or a prolonged First-time user experience (FTUE). In this case, fewer users will convert to purchase, because fewer users make it to the point when they are introduced to the store. That in addition to some crashes during purchase plus changes in live-ops could lead to a declining trend in D7 ARPU.
The grand summary
- Use Organics as a benchmark to compare to Paid metrics
- Adjust your benchmarks for traffic mix differences
- Look not only at the difference in trends but also at trend line steepness & % change in the metric you are comparing
- Check the mathematical reasons for the decline of the metric in question for Organic and Paid traffic
In the end, figuring out why the UA efforts are not as profitable as before is all about being curious. As well as finding the right baseline and comparison point. And after all, whatever the reason for the decline, it is best if marketing & product work together to solve the issue!
Don’t forget to subscribe and you will get notified 1 day before we publish our latest insights anywhere else.