



Depending on the role you have in the company (CEO, CMO / Head of Growth, Performance Manager, etc.), you may recognize some of these questions in your day-to-day:
Table of Contents
- (Board Member to CEO) – Why are we spending so much on Paid UA in the last few months? What return are we seeing?
- (CEO to CMO / Head of Growth) – What ROAS are we getting in Android campaigns? Do we really need to spend so much money in [insert specific country / tier here] ?
- (If you’re a Performance Manager) – Can you make a report for us to see the CAC by platform and country? I’d like to understand if our LTV:CAC is sustainable.
If you own paid acquisition, a dashboard should help answer a decision like these. Agree on the outcome, cost definition and reporting window before choosing charts. Then build the smallest view that lets the team identify a problem and decide what to investigate next.

It’s not a surprise that working with data is an integral part of every User Acquisition (UA) specialist’s everyday life. We use data to measure our campaigns and make optimizations accordingly. We also use different charts and tables to understand data trends and causes / correlations. This is where data visualization comes in. By having high-quality and visualized data we can make sure to get insight in the most effective and efficient ways. But with this article, we want you to go beyond the simple DataViz tool you use (PowerBI, Looker Studio, Metabase, Tableau, etc.). Because yes, the tool is good, but in the end, what’s important is what you do with the tool. Because having the best fork on the planet is of no use if you’re going to eat soup.

Now that you already know (well, you probably already knew) that the insights are more important than the tool, what do you need to keep in mind to get the most out of “your dashboards” in your data-supported life We’ll divide our recommendations into several phases:
- Basics: things that we sometimes overlook, not directly related to campaigns but VERY necessary. We will delve deeper into these in the upcoming article.
- Operational: things that you, as the lord and master of Acquisition, will find particularly helpful.
Basic 1 – What do you want to achieve?
– Let’s make this dashboard. And this one too. No, better with a pie chart. No, better with a table with these ratios. And let’s also add a trend chart by month. – But, what do we want to measure? – Uh, no idea. Actually, good question The first thing we recommend is that you forget about dashboards and graphs and, on paper/Google Doc/Notion page or whatever, write down what you want to achieve with your campaigns. In other words, write down the KPIs that will guide your decisions. Are we going to optimize the campaigns to have more volume of installations? Do we want to improve the conversion rate from installation to a specific in-app event? Maybe we’re looking to have a ROAS above 1/100%? We don’t have the answer for you, but point 1 is to define the basic KPIs of your Acquisition strategy. And if you need help defining them, count on us.
Basic 2 – Think about upwards reporting. For real.
Leadership usually needs a clear view of acquisition cost, customer value and the decisions required. An Apple Search Ads optimization or creative CTR change belongs in that view when it explains a business result or a proposed action. Provide a route into the detail, label incomplete cohorts and welcome questions about assumptions. Questions are not, by themselves, evidence that the report has failed.
- Leadership / C-level view: a generic view with an overview of all of the KPIs
- Operational view: a granular view including costs, pre-install and post-install metrics, and of course revenue with absolute & relative numbers, and trends. Depending on your KPIs you will also need some additional metrics but the point is to have useful and as granular data as you need.
Basic 3 – Don’t go overboard. Let’s focus on the MVP Dashboard.
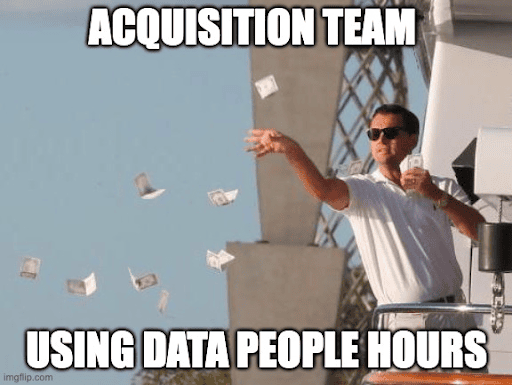
It’s great to be able to filter campaigns by country and language and add 10 different types of filters that allow you to see endless possibilities. Plus, having graphs in multiple types and colors, and being able to export everything in PDF and CSV is a nice touch. But let’s be honest. You might end up only using 5%-10% of all these features, which means you’re wasting a significant amount of your Analytics team’s time. And if we’re using data to support decisions that ultimately help us make more money (because every company wants to improve their results, right?), then these hours spent on Analytics may actually become a significant overhead cost. Think about what you need in the short term. Those data points that you absolutely cannot move forward without – are the basic KPIs. And when you have identified the basics, go back and reconsider, because chances are you’ve asked for too much.
Clever trick:
It can be helpful to imagine that for every data point you request, your Paid UA campaign budget is reduced by 5%. If that were the case, what would you ask for? This exercise, though simple, often helps put things in perspective and reveals what is truly necessary and what is not. Because the last thing we want is for the CFO (or top financial executive of the company) to think this about us, right?
Basic 4 -Not knowing where the data comes from
Can you imagine going to a remote country and eating something without knowing what it’s made of? It’s scary, right? What if it contains something you’re allergic to? Or imagine being asked to jump into the water without being told how high it is. Is it 2 meters? 10? 20? Knowing the fundamentals of things matters a lot when making the right decisions. The same applies to your campaigns. Don’t settle for what you see in the dashboards without knowing where the information you’re consuming is coming from. Because repeat after me, it conditions YOUR decisions. Yes, yours. Not the Analyst (or any other role) who created the dashboard. So, step out of your comfort zone of CPCs, CPIs, and Ad Networks to start understanding if your data is coming directly from the consoles if it’s coming from some Data Warehouse that your Data team is using, or if it’s coming from another source. And above all, find out if these data points have undergone any transformation along the way. We’re not asking you to understand SQL (although it would be helpful) or how tables are structured in your Database or Data Warehouse. But if terms like Data Studio, BigQuery, or metrics and dimensions scare you, don’t worry, we can accompany you on the journey. We’ve done some reporting for clients before
Conclusion
Knowing how to optimize your campaigns is important. And it matters a lot. But unfortunately, it’s not everything. If you want to take your Paid UA campaigns to the next level, you have two options:
- Change campaigns without a clear outcome or comparable reporting, leaving the result difficult to interpret.
- Get the basics under control and then start optimizing your campaigns.
And yes, we are aware that all of this requires a lot of hours, effort, and being on top of an infinite number of things. But nobody said that growing companies was easy, right? If you want to talk more, tell us more here.