




This article reports a 2021 Facebook Ads experiment comparing separate country campaigns with grouped markets. The results below varied by country and operating system. Use the test to form a hypothesis for your own account, rather than treating the reported ROAS improvement as a forecast.
Table of Contents
A 2021 Facebook Ads country grouping experiment
The test below compares separate country campaigns with grouped markets. Its reported results vary by country and operating system, so the useful question is which structure supports the business outcome in your own account.
The easy assumption is that if you go for one country targeting strategy it would be easier to:
- Control the performance of each country
- Increase or decrease bids and budgets per country
- React to local events
- Localize your creatives and much more
I tend to agree with that statement, depending on our clients’ goals. On one hand, it is true that you have more control over your spending but on the other hand that does not necessarily mean that you will achieve better results.
Can Country Grouping drive better results?
Let’s assume your website or app doesn’t care where users are based as long as they make some purchase. You do not have a local community or marketplace model or some restrictions to offer your service outside your main target country, let’s say the US. How much does it really matter that your actual user resides in the US? As long as revenue rolls in, does it matter if it was from Ireland?
Our hypothesis is that there are millions of financially independent individuals out there that speak English, French or whatever who might be interested in your products but you ignored them because your thought was, the best users are from the United States. Well, after so many years in advertising I can tell you Algorithms of Facebook or Google need food and they need a lot of it.
Audience size is a planning constraint, not a success threshold. A larger eligible audience may give delivery more room, but it also changes who receives the budget. Group markets only where product availability, language, pricing and the business goal are compatible, then compare cost per valuable customer and mature cohort revenue by country.
Learn More: Facebook Ads Agency
Campaign Experiment Overview and Results
The whole experiment ran from February 23rd to March 7th and we reached over 1 million people.
Firstly, we launched 6 app campaigns the traditional way, split by country and Operating System on Facebook targeting 3 countries (Canada, United Kingdom & United States), 3 campaigns targeted iOS and the other 3 went for Android. So, the 6 campaigns were:  We used the same amount of ad sets within each campaign, using the same event optimization, equal targeting, and lookalike audiences. We also included the same ads within each ad set and we run the campaigns for 7 days.
Let’s say this set of campaigns created our baseline to compare with the later tests of grouping countries.
New Strategy: Country Grouping
We now launched two new campaigns with the same ad sets, ads, and event optimization but instead of using one country targeting strategy, we included a bunch of countries, 11 to be precise. They also ran for 7 days. So, these new campaigns were: 
How many countries shall I include in each Group?
Start with markets where the app is available and where pricing, payment options and service fit make acquisition commercially useful. Set a test budget and observation period for the outcome you need to compare; neither a fixed country count nor daily spend establishes statistical significance.
The useful number of countries depends on how much signal your budget can support and how different their economics are. Inspect where spend actually lands; a grouped campaign can concentrate in a few markets and leave the others with too little data for a reliable comparison.
A shared language can make creative reuse practical, but it does not make markets equivalent. Check local wording, offers and customer value before grouping countries, and retain country-level reporting.
Results
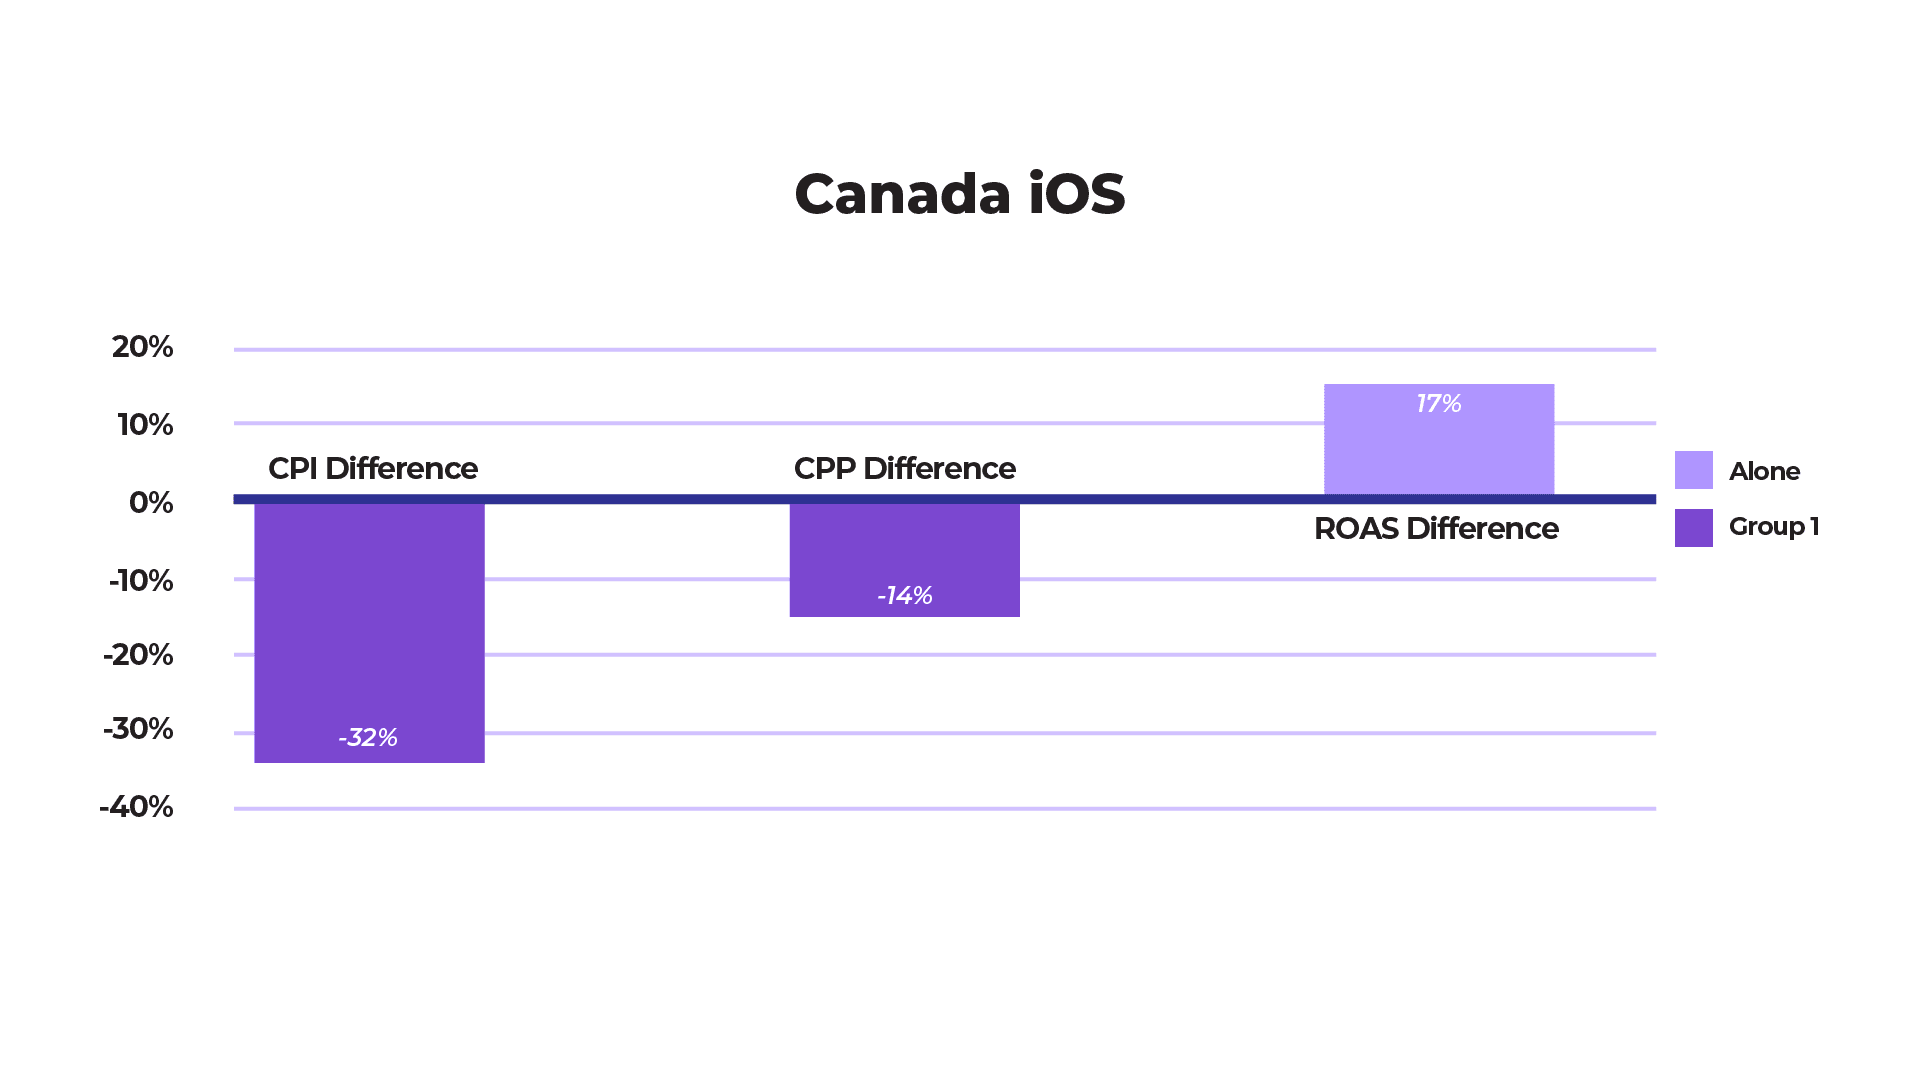
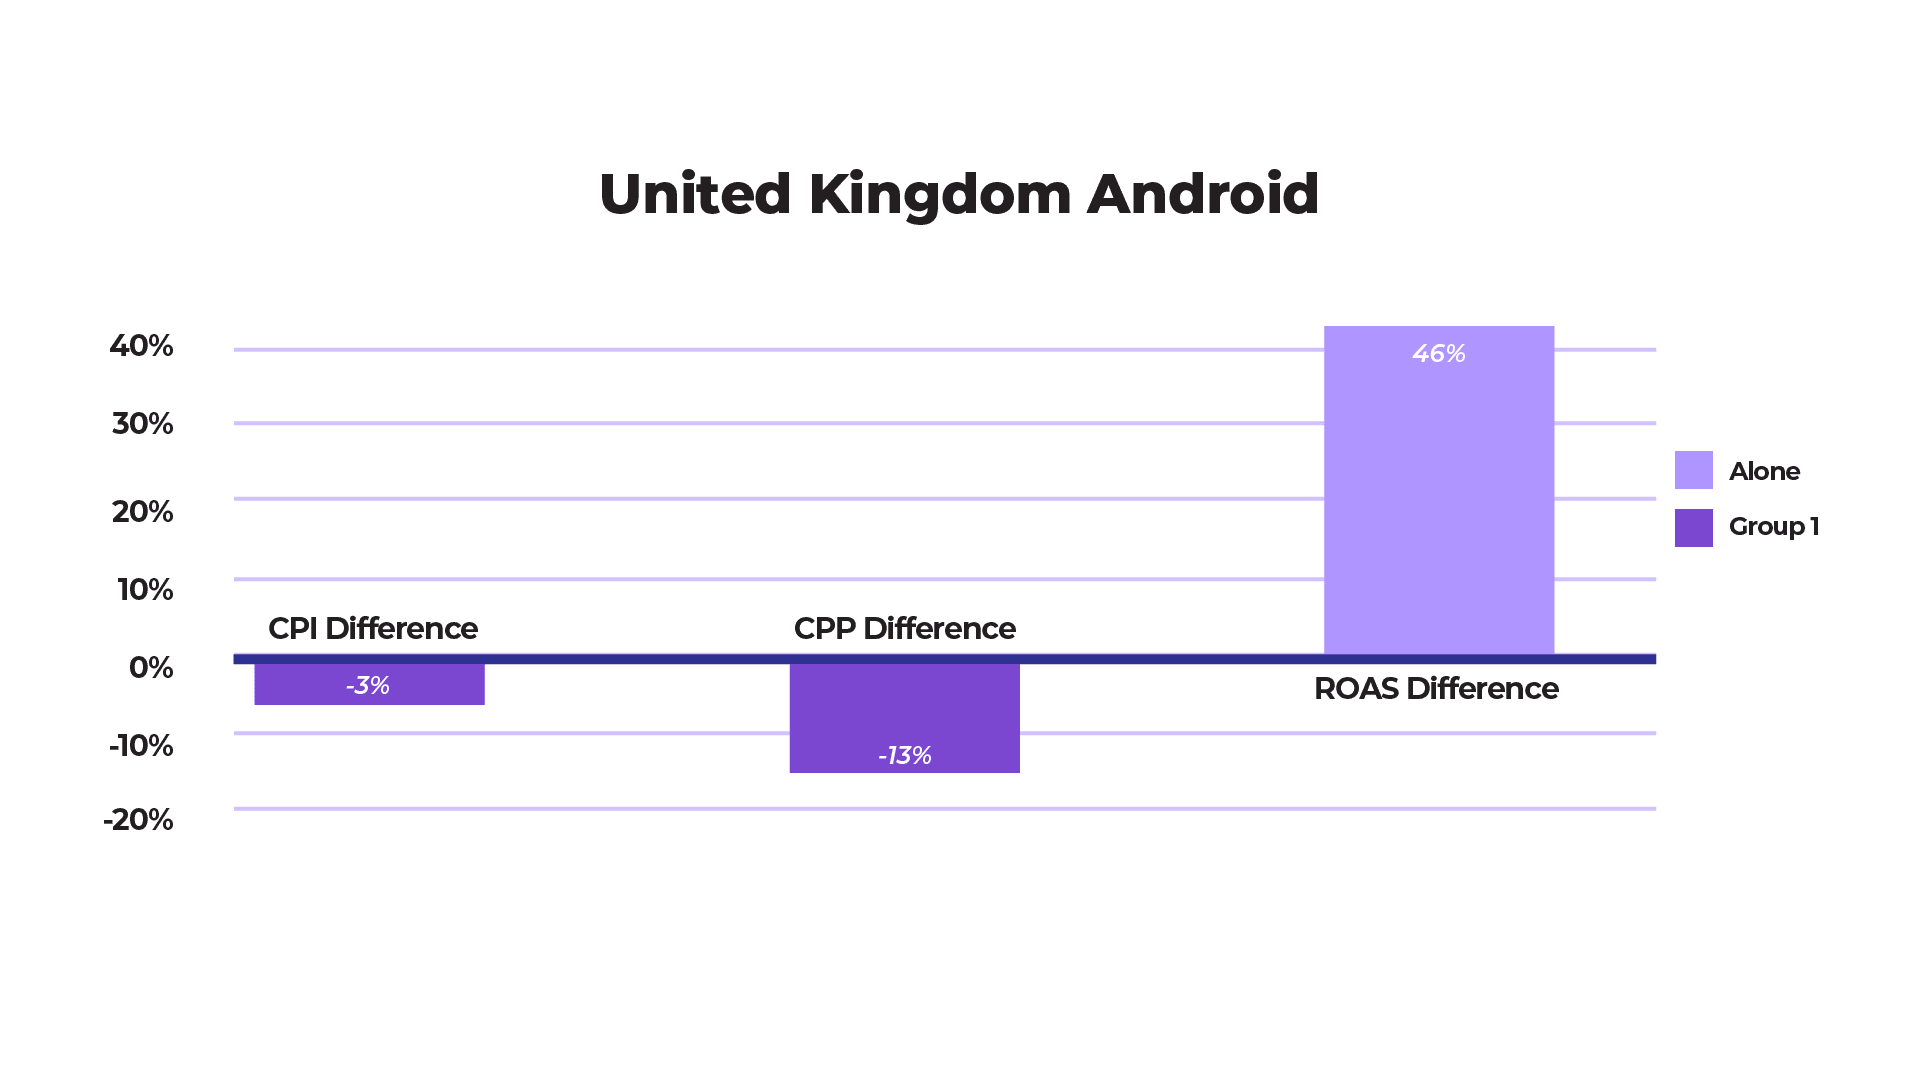
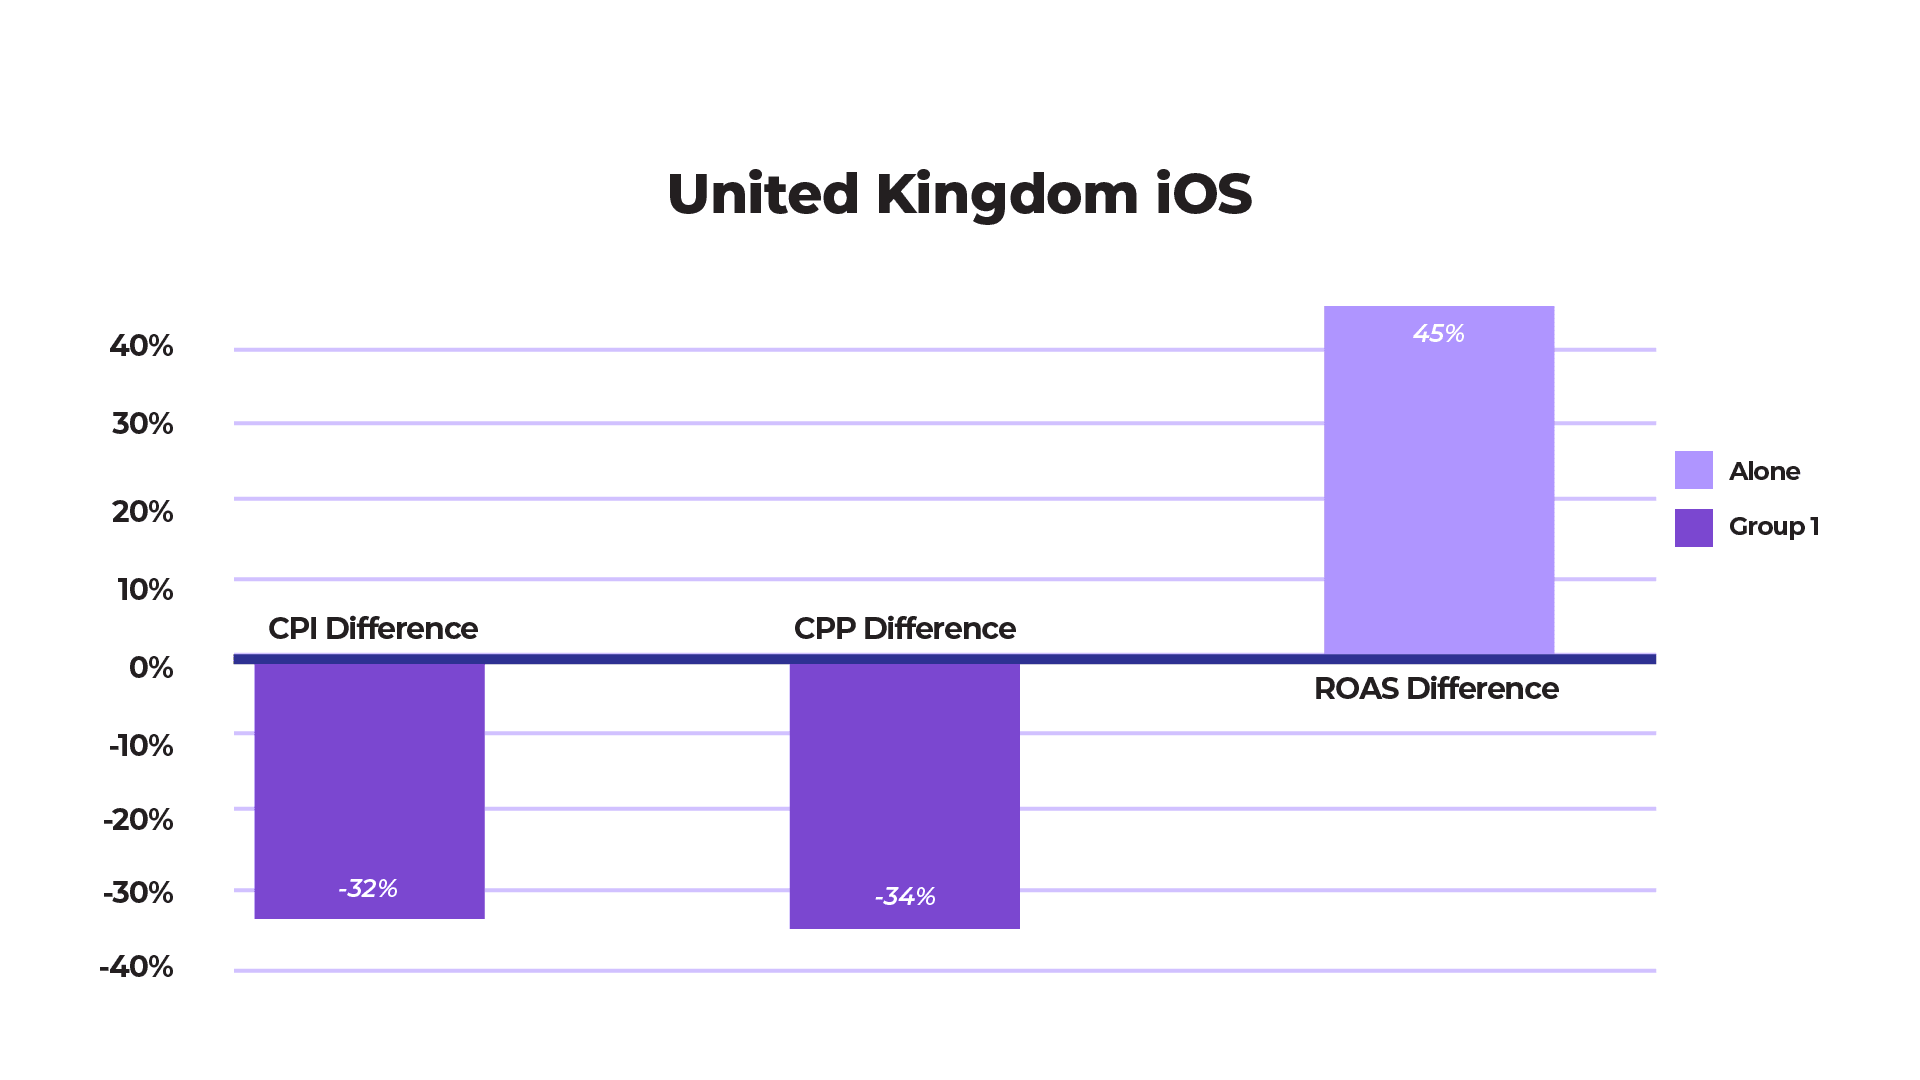
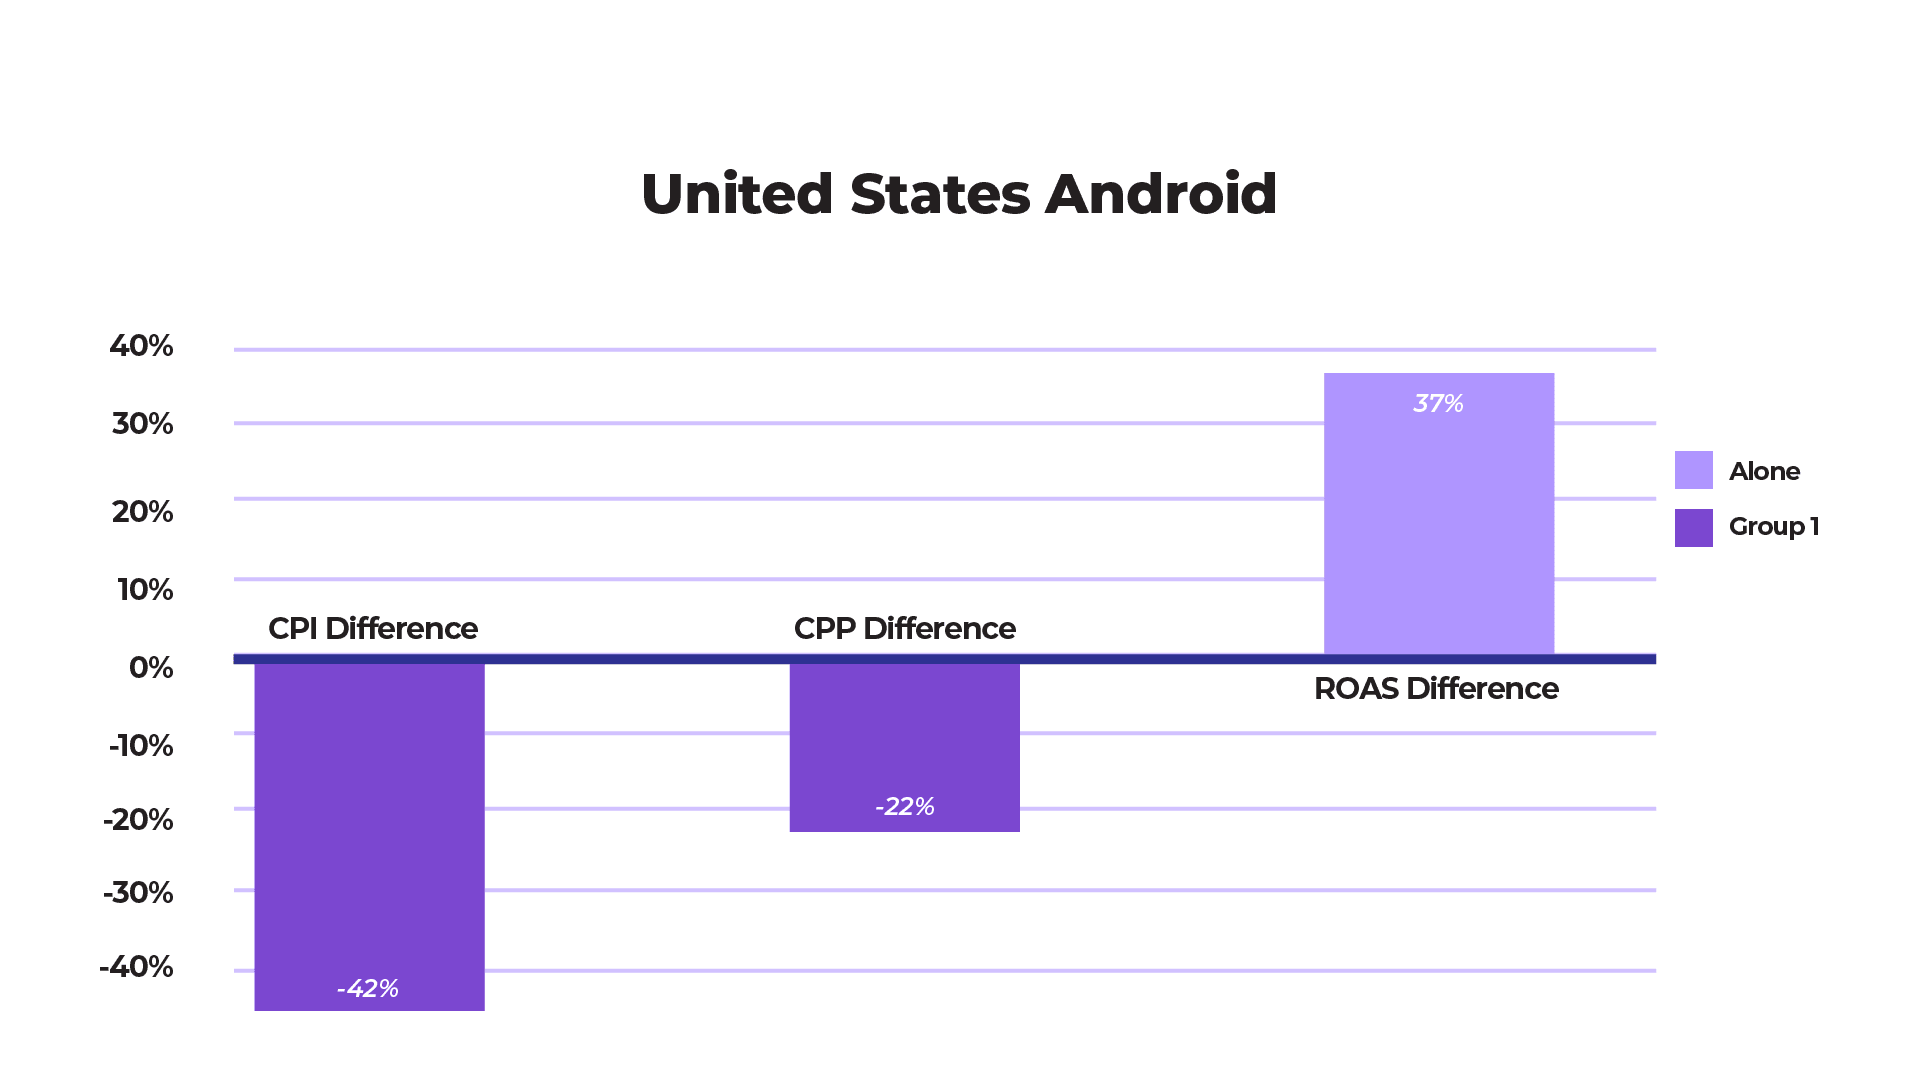
As we can see in the below table, we analyzed each segment separately and tried to pick a winner (in green) taking a look at the KPIs differences in percentage. We compared CPI, CPP, and ROAS differences between the two segments for the 3 countries and the 2 operative systems.
- CPI = Cost per Installs
- CPP = Cost per Purchase
- ROAS = Return on Adspend
 Canada_AND: It is hard to pick a winner here as the CPI & CPP prize goes for Group1 (CPI was 34% cheaper and CPP 14% lower). However, when targeting Canada alone, we obtained a 17% higher ROAS. As this last metric is more important at the end of the day, we will favor the Alone strategy.
  Canada_IOS: Group1 is a clear defeater.
  United Kingdom_AND: CPI was slightly better for Alone targeting, however, CPP & ROAS were clearly in favor of Group1.
  The champion is an alone targeting strategy – United Kingdom_IOS:
  United States_AND: The price winner is once again Group1.
  United States_IOS: Once more, the award goes to Group1.
 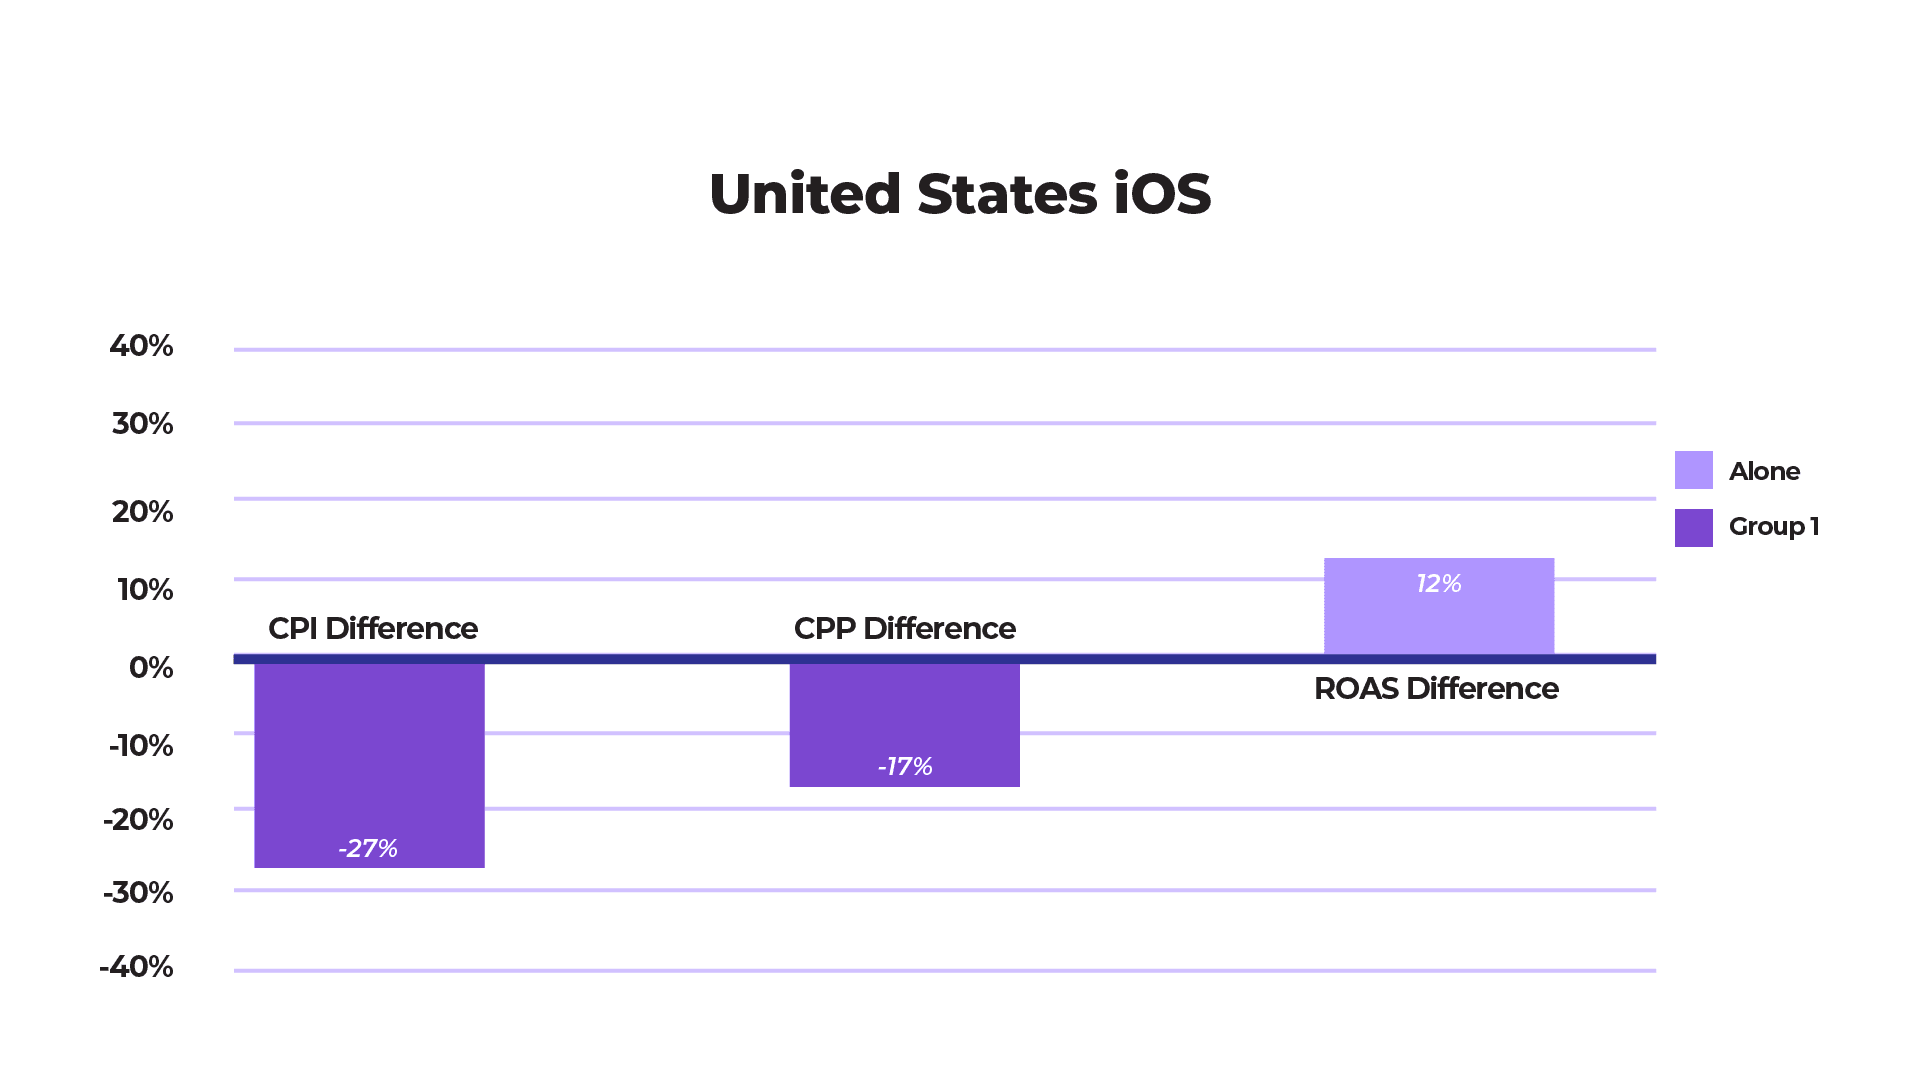 Note: These 3 countries drove 85% of the total spend in the Group1 campaigns.
What happened with other countries?
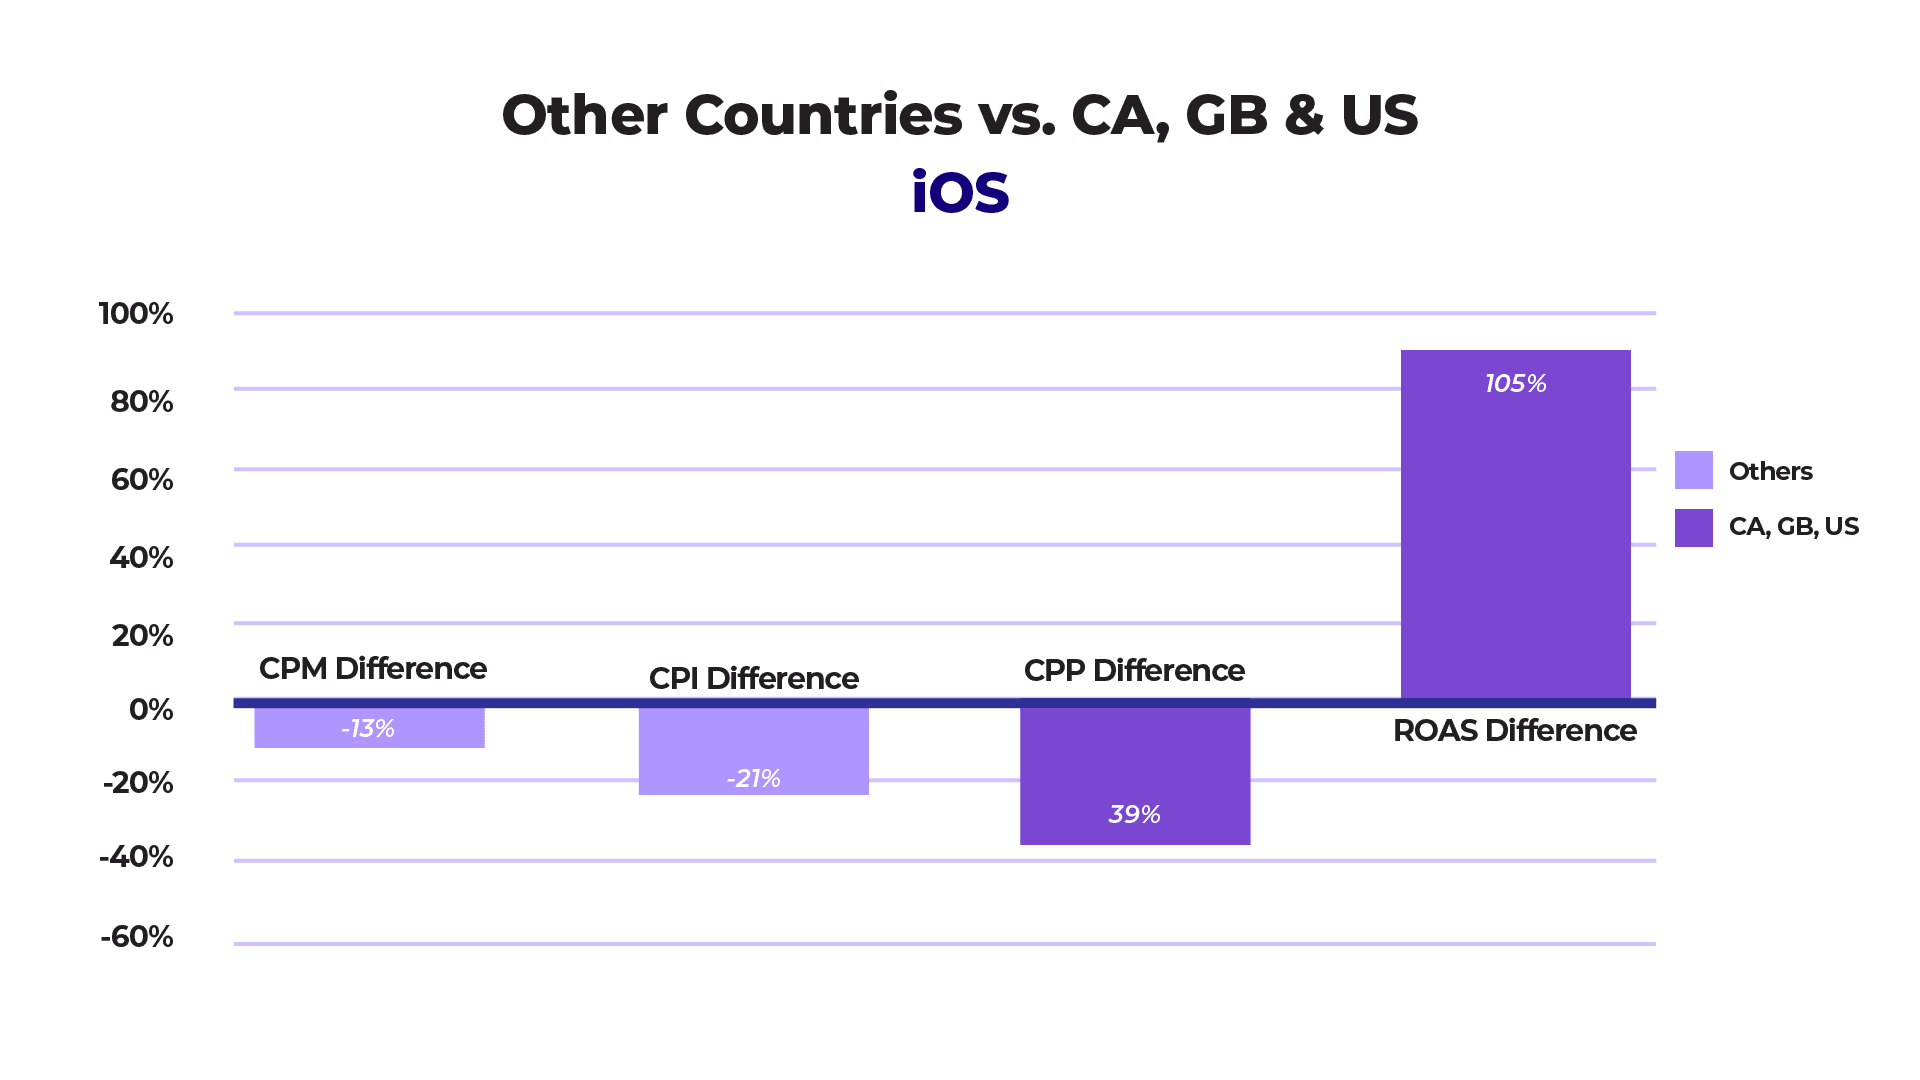
CPI difference was clearly on Other countries’ side, however, CPP & ROAS analysis makes it more complicated to pick a winner. Android drove better results in CA, GB & US campaigns but iOS was completely the opposite. The hypothesis for such results is that the lower competition in Other countries got lower CPIs & CPMs. Nevertheless, iOS users in CA, GB & US were harder to be persuaded purchase-wise, leading to a higher CPP & lower ROAS. 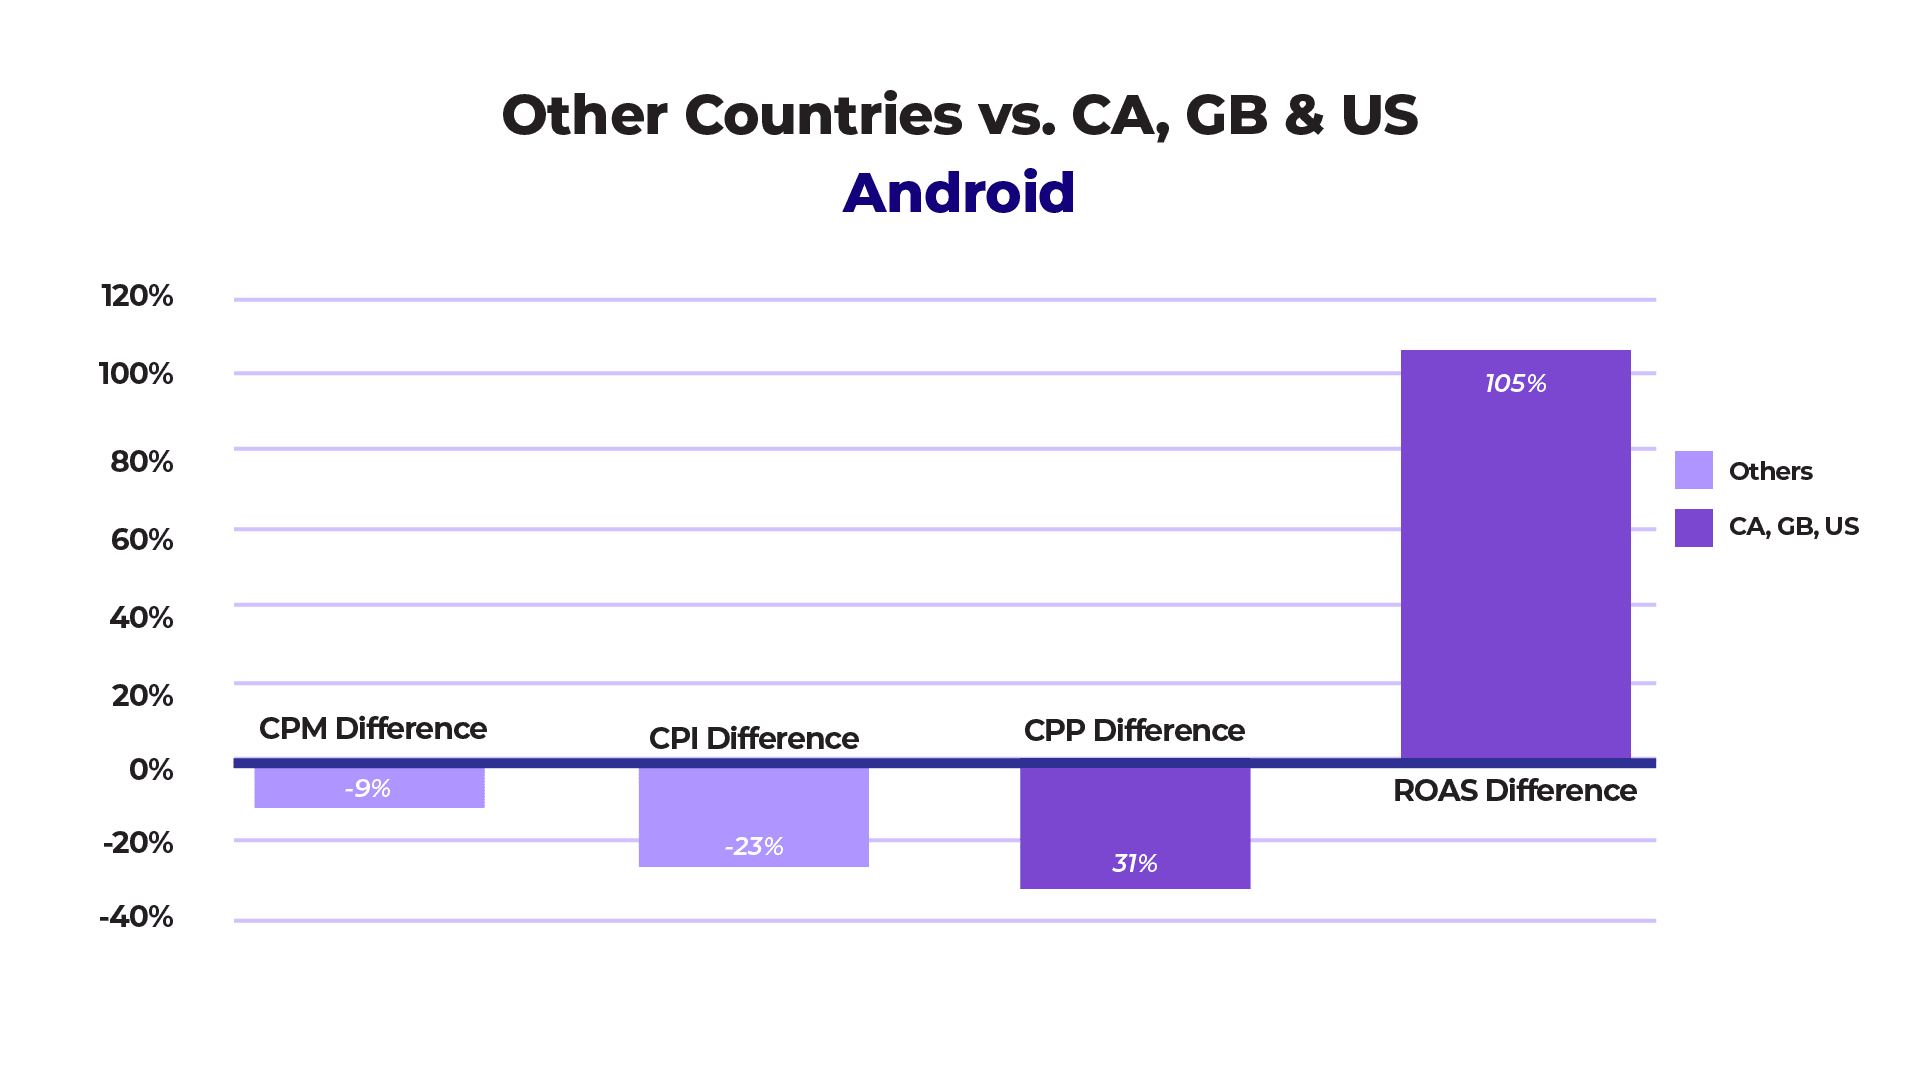
What you can learn from this Case Study
Grouping improved several reported metrics in this experiment, while individual-country campaigns still won in some segments. The two approaches ran in successive seven-day periods, so time effects and auction changes may also have influenced the comparison. Test your own hypothesis with comparable conditions, and use incrementality testing when the decision is whether the extra spend creates additional business outcomes.
Why grouping countries seem to be positive?
Our assumption is that the key for much better results in some cases is that the algorithm can take advantage of cheaper KPIs (especially CPI) in those countries with lower competition at a given moment. Let me try to explain this a little better: Let’s say you have 5 competitors on your auction per country targeting a similar audience, but one of them suddenly stops promoting its app/website in one of the countries. At this moment the auction gets cheaper and Facebook obviously knows that and can fill the space with your ad. You benefit from cheaper CPMs and can convert a user. This leads to overall better performance as our campaigns’ bidding decreases, getting also cheaper Installs in the good countries. Read more:
That’s it for now, stay tuned for our next article!