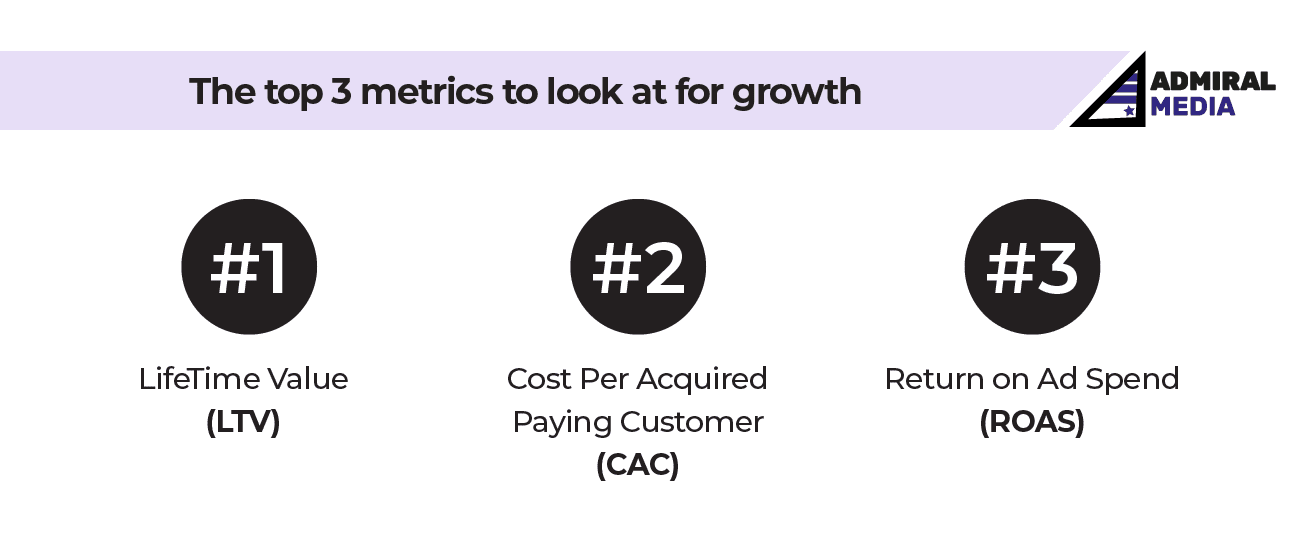
When it comes to startups, there’s an undeniable desire for growth. Not only do more customers mean more revenue, but also more awareness and potential for a larger customer base. The question is: what are some of the top metrics that prove growth? Let’s review the top 3 metrics to look at for growth! Of course, you could simply show a growing number of installs, revenue, MAUs, or DAUs. But such plain metrics mean nothing in context. Your revenue could just be blown up by increased marketing spending. Sudden organic behavior not driven by product features but maybe press mentionings. Those are all factors that can help grow fast. But you will fail if your app or website doesn’t prove growth with these 3 most important metrics you need to watch. And improve step by step. In the following, we will dive deeper into these three metrics. Life-time value “LTV”, return on ad spend “ROAS”, and conversion rates “CR”. Let’s get started.
Table of Contents
LifeTime Value (LTV)
Lifetime value, or LTV for short, is a simple equation that predicts how much the total amount of money a customer may spend over the course of their relationship with your company. The lifetime value of a customer is determined by three factors: Customer Acquisition Cost, historical revenue of a customer, and Retention Rate. The Lifetime Value (LTV) is calculated by multiplying the estimated average revenue per user by their retention rate. To calculate Lifetime Value, just follow these steps:
- Calculate the Customer Acquisition Cost (CAC) by dividing your total marketing or advertising expenses by the number of acquired users.
- Calculate the Estimated Average Revenue per User (ARPU) by dividing the total revenue by the total number of users in a specific time range. (You may also be interested in ARPPU, the average revenue per PAYING user).
- Calculate the Retention Rate (RR) by following these easy steps:
-
- Find out how many customers you have at the end of a given period (week, month, or quarter).
- Subtract the number of new customers you’ve acquired over that time.
- Divide by the number of customers you had at the beginning of that period. Then, multiply that by one hundred. And, a quick Google search will give you many online calculators to get the RR but you can use excel sheets too.
The last step is to calculate LTV by multiplying AC, ARPU, and RR
The RR will tell you how sticky your product is – do customers come back after the day of acquisition? How often do they come back and how many days are in between Day0 (day of acquisition) and Day 15 when the first sale may have happened. Knowing your LTV helps with budgeting for new services, campaigns, and products/forecasts profitability. With an understanding of what makes up your customer’s LTV, you’ll be able to make more informed decisions about which customers you want to spend more time and energy on. These insights may also help cut down on costs in other areas as well.
Cost Per Acquired Paying Customer (CAC)
CAC is a metric that determines the cost of acquiring a paying customer. You can calculate it by dividing the total cost of marketing/advertising by the number of paying customers acquired. It’s important to be aware of your company’s CAC, as it can tell you a lot about what strategies are working for your business or how much money you may win or lose by comparing CAC to LTV. Imagine your calculation shows a CAC of 10, but your LTV is only 8. You quickly know this won’t last long and you should do something. Most importantly, CAC helps marketers to understand how efficient their activities are and gives them signals to tweak their plans to minimize CAC. 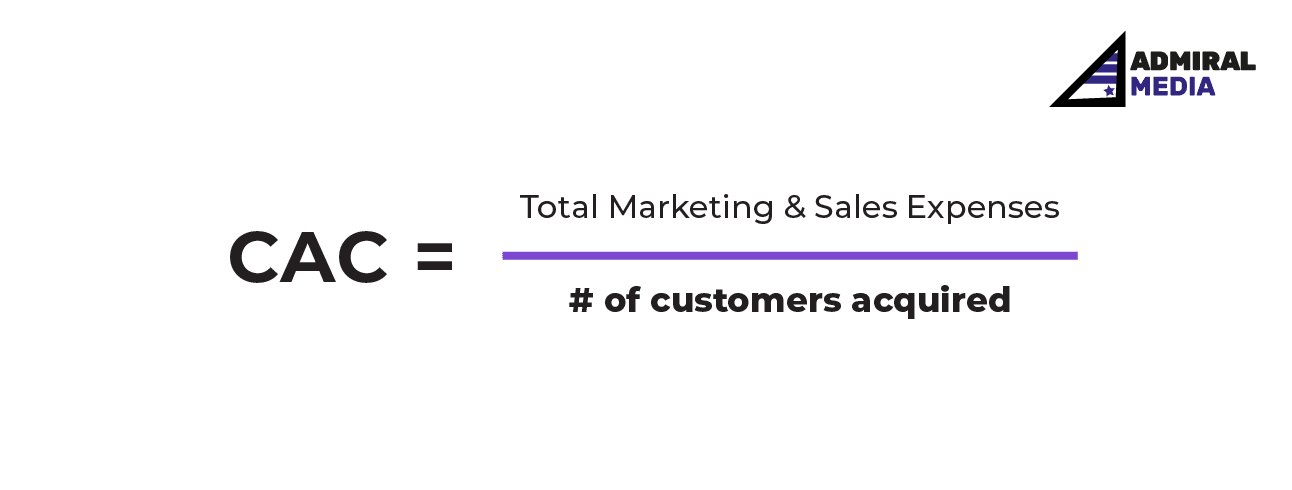 In an ideal scenario, a low CAC will help you safely increase your advertising budget to bring more users while maintaining this CAC to achieve exceptional growth rates.
Here are 3 ways to reduce your CAC
- Increase your rations: assuming that you’re promoting a subscription in your app, you can increase your install to signup rate, signup to subscription rate, or just install to the subscription rate. For example, you spent $10 and got 10 installs that generated 2 subscriptions which make your CAC = $5. If you optimize your funnel to increase your install to subscription rate to generate 3 subscriptions from the same 10 installs that you acquired at $10, then your CAC will drop to $3.33
- Retarget dropouts: continuing with the above example, you have 7 users who didn’t convert into subscriptions, assuming you spent $10 more to retarget them and generated 5 subscriptions at a CAC of $2. Then your overall CAC after the retargeting will become $2.5
- Spend efficiently: looking at your CAC broken down by ad channel, campaign, adgroup, and/or ad will help you understand where you acquire expensive paying customers vs ideal cost to maintain profitability or even increase it. Here you just need to decrease spending on expensive channels or campaigns to spend more where you get the most value.
Lowering your CAC is one way to be successful obviously, but there is so much more you could do looking at the other metrics, eg. RR or LTV which can be dramatically improved by a few simple product changes maybe.
Return on Ad Spend (ROAS)
It is a metric that shows how well an advertising campaign is doing with regard to the amount of money spent. In other words, ROAS measures how much value or return you are getting from every advertising dollar. 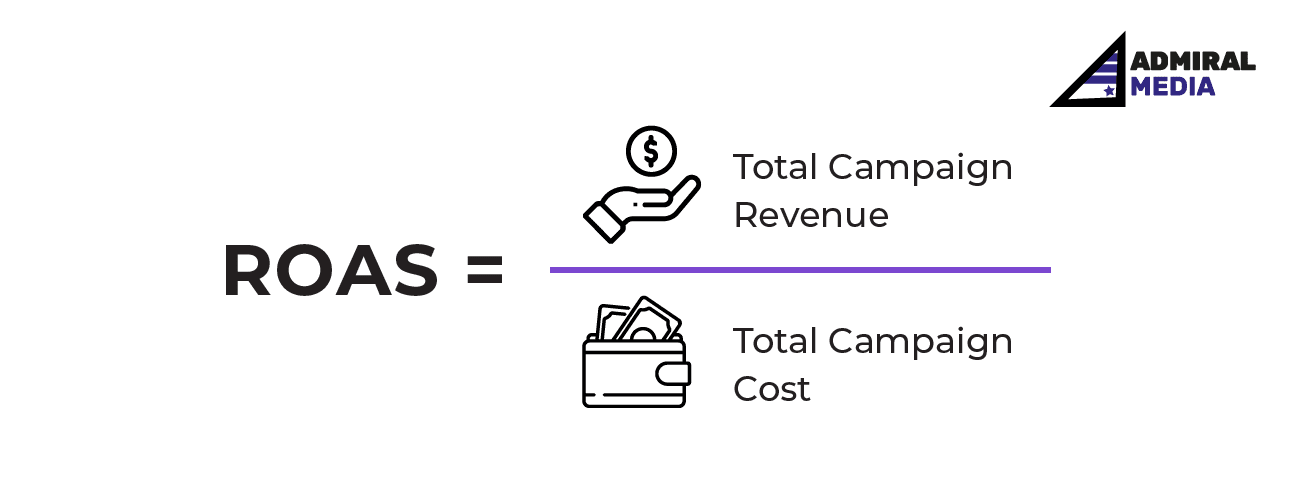
Calculating ROAS
It is very simple and straightforward. Just divide the total revenue from an ad campaign by the total spent on that ad campaign. The ROAS formula takes into account the revenue derived from advertising over a certain period of time. It does not take into account any marketing costs such as design, production, or personnel because these are included in your return on investment “ROI” formula Your goal here is a high ROAS because it indicates a higher spending efficiency and thus indicates that your agency partner or your marketing team is making better decisions and following a good strategy to obtain business goals. Again – here comes a tricky thing that many people don’t know or simply ignore. If you don’t know when your customer clicked an ad (costs incurred) you won’t be able to truly understand your ROAS. The above-mentioned cohorts play a huge role here. You need to check your total revenue against your Day0 revenue, the revenue that happens just the same day you acquire a new user. You will quickly understand that Day0 revenues are (in most businesses) much lower than total revenues. Now imagine you simply pause all marketing but still you may receive revenues … you need to understand how many days this chunk of longtail users comes back to you and keeps purchasing / making revenue.
Bonus
There are a number of different growth metrics you may wanna look at but each metric will give you a piece of the final picture and there is no single measurement that can dictate if your product will grow profitably or not. Here are a couple of extra metrics that will help you get an additional piece of information about your mobile app marketing and website growth:
- Click to Sign up rate: This metric simply gives you an understanding of how many users really sign up from the number of users who click on your ad. It’s important to understand if you’re really targeting your buyer persona or just doing it and hoping for luck. Also, Sign up here could be a different event such as trial started or app install…etc
- Sign up to purchase rate: This metric will give you information on your purchase ratios or simply how many users purchased after signing up. You can use such information to enhance your purchase flow or your conversion funnel and gain more customers. Also, Sign up or purchase here could be a different event such as trial started or subscribe…etc
- Average order value: is the average money spent when a user makes an order. This information will help you adjust your marketing and pricing strategies and your goal here will be to increase this average order value.
- Cohort Cancelation rate: Here you learn the percentage of users who cancel their subscription within a certain time frame. Usually, businesses look into the Day0 cancelation rate to evaluate the success of a certain market, offer, or campaign. You should use such information to adjust your strategies and your goal is to decrease such cancelation rate which means more revenue to your business.
Conclusion
 All you need to do is to look at multiple growth metrics to get as close as possible to the full picture. And create your own north star metric that meets your needs because managing growth is simply more difficult than just one specific metric. your growth lead should be doing it like this already. That’s it for this one, like and share. Ciao!